

Retrieving daily attendance records is a common practice in schools but for schools that use meeting attendance, trying to determine if a student was considered absent or present at a daily level is nearly impossible for everyday users.
If they can somehow figure out a student's attendance status for a given date, trying to then gather summary data of how many times a student was absent or present is even more complicated.
But now with the use of our Daily Attendance Summary by Date Report, schools can retrieve aggregated daily attendance values for students and easily filter the data by date range, calculated attendance value, and even the number of occurrences for each.
How to run the report:
Before navigating to the reports, you can select from the start page the group of students for whom you want to run the report. This could be anywhere from a single student to the entire school.
Once selected, click on RealTime Reports from the Level Data apps section on the start page. Once in the dashboard, select the attendance summary by date report. Once the pre-filter appears, you'll enter the date range for which you wish to report.
The student selection will indicate the group of students you've previously selected. Once your selection has been made, click run.
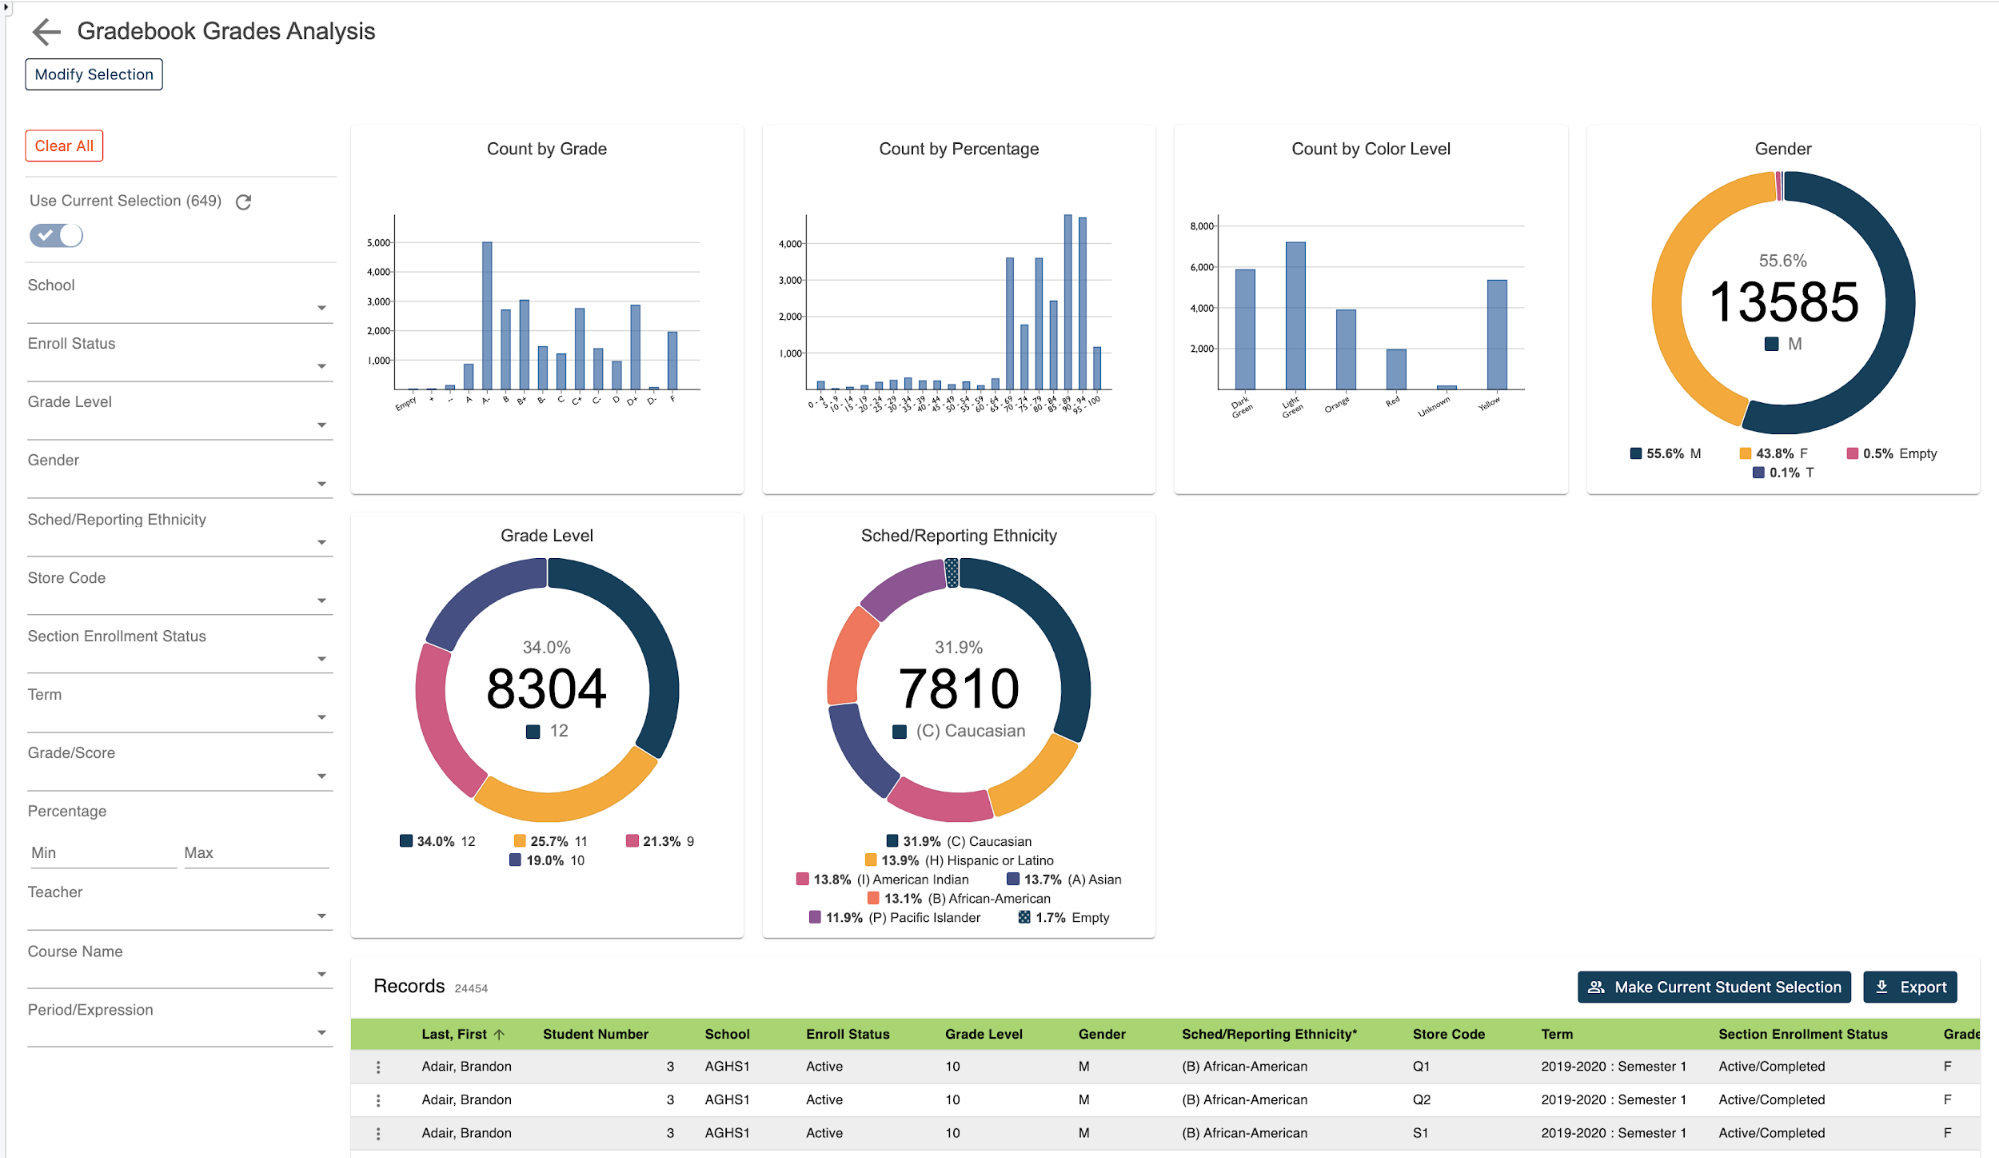
Once the report loads, you'll see a graphical breakdown based on calculated attendance values. The graph will display a tally of these values based on the attendance conversion and use.
In addition to the attendance graph, you'll also see a breakdown of student data by grade level, gender, and scheduling ethnicity.
Individual student records:
To view the individual student records, scroll down the page. In the table, you'll see a list that includes a record for every student from the original selection for each calculated attendance value associated with the student for the selected date range.
In addition, the report will include the count of how many times each value has been applied. Typical values would include present, absent, or partial if your school assigns partial days of attendance.
Student data can be filtered based on any of the displayed fields. For example, you can select an attendance value or values from the calculated attendance value filter and then use the count of attendance values to limit the results to just those students that have reached a specific threshold.
Exporting your report:
Once your results have been filtered, if you'd like to work with the selected group back in PowerSchool, you can click on the make current student selection button to create a new student selection.
Or you can click the add to current student selection if there's already a group you're working with and you'd like to add these selected students to that list. Or if you just need to export the results click on the export button to generate a CSV file that includes all the data for the filtered group of students.
No need to know any field names, table names, or complicated dot tags!
Getting to your data has never been easier.