

How often are your staff tasked with looking up students' current grades? What about generating at-risk reports or eligibility lists for participating in activities? What hoops do they have to jump through to get to this data and how long does it actually take?
Wouldn't it be great if you could get to this data with just a few simple clicks? Well, now you can with the use of our gradebook grades analysis.
This type of report is just a few clicks away.
How to run the report:
Before navigating to the report, you can select from the start page the group of students for whom you want to run the report.
This can be anywhere from a single student to the entire school. Once selected click on RealTime Reports from the Level Data apps section of the start page.
From the dashboard, select the gradebook grades analysis. When the pre-filter opens it will display with the selected group of students, all you need to do from here is click run.
Once the report loads:
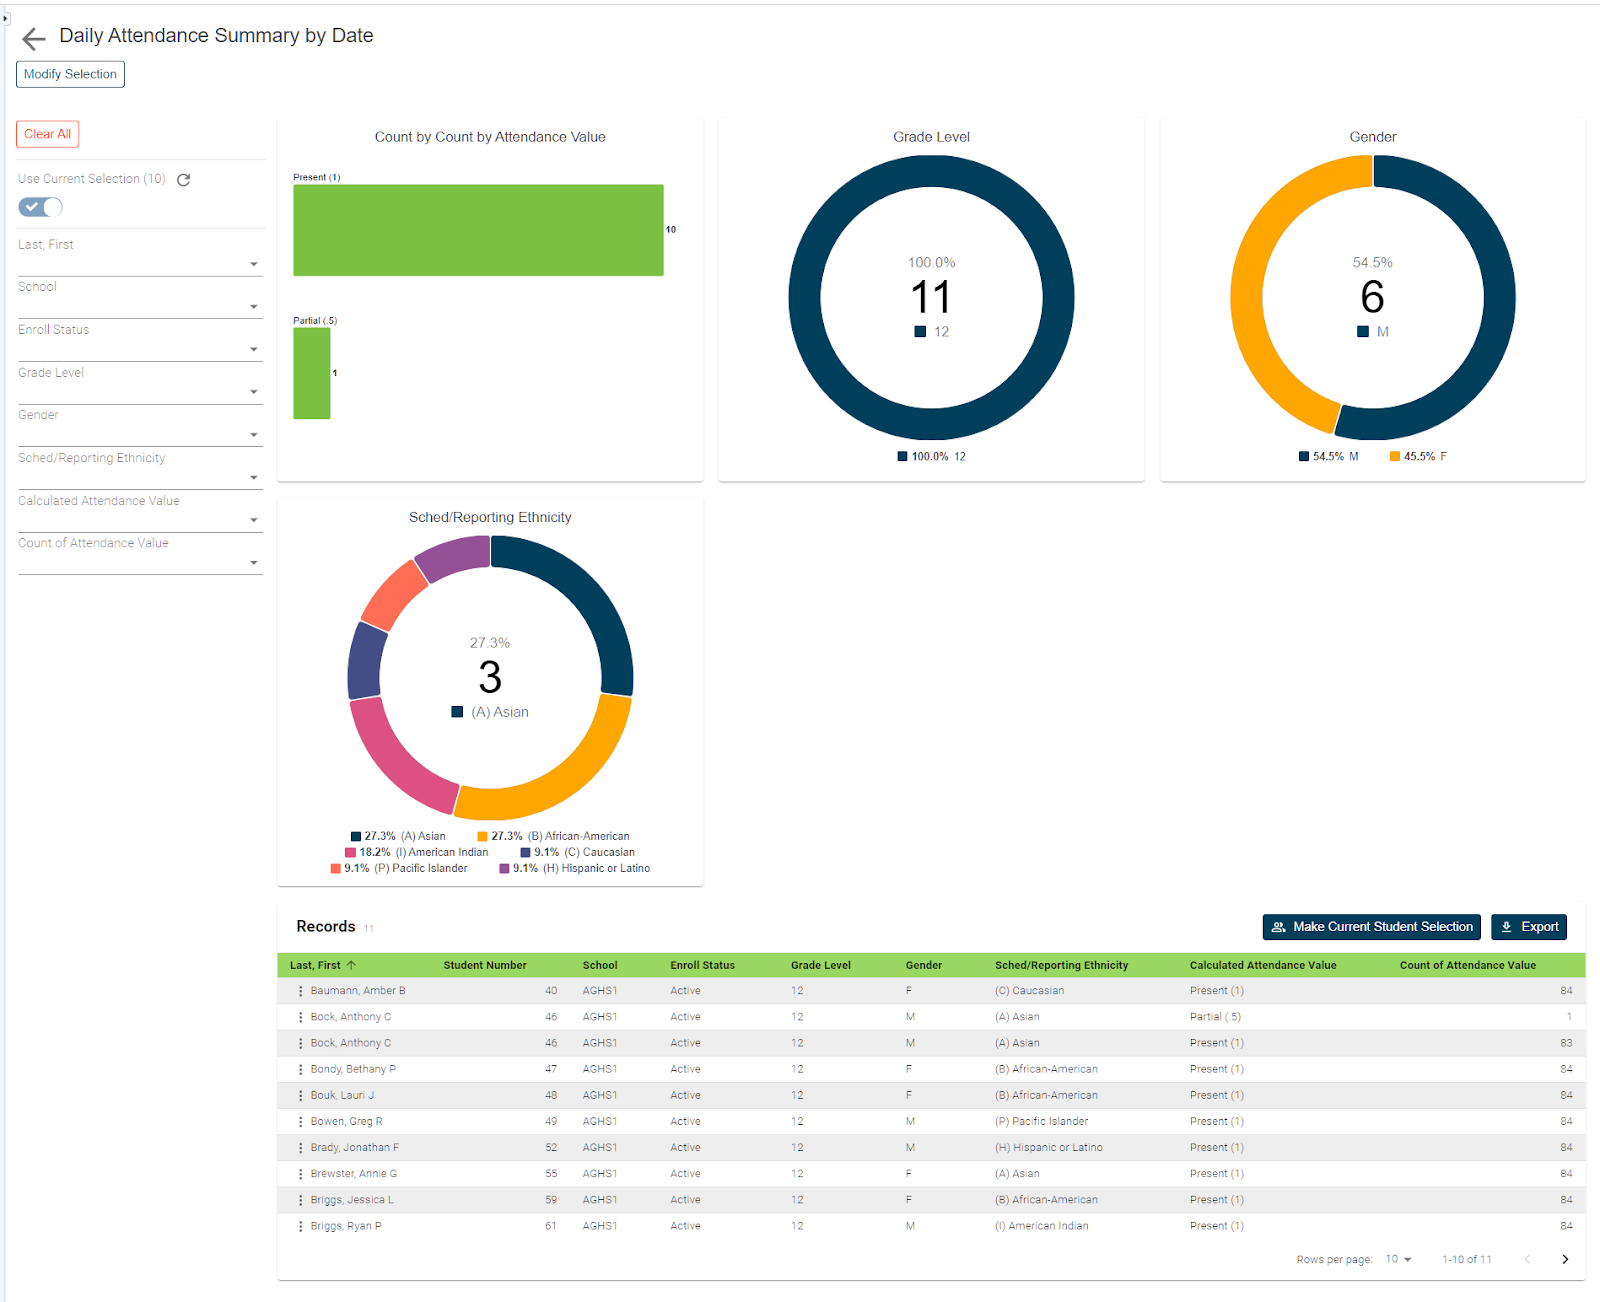
Once the report loads you'll see a graphical breakdown of data by both grade and percent scores as well as gender grade level and which activity. To view the individual student records scroll down the page.
In the table you'll see a list that includes a record for each student, for each course and term grade that includes basic demographics data along with specific data items such as a store code, class term, enrollment status, course and teacher name, expression or period the class meets, and most importantly the grade and percent scores.
Data from this report can be useful in several ways from looking up grades for a single student in reviewing grades for students that participate in various activities or even identifying students at risk for not passing classes for a selected term.
Getting to the data you need is as simple as selecting the necessary filters. For example, if you'd like to find all of the students in quarter 2 that are not currency passing simply select ‘Q2’ from the store code filter, and then from the grade score list select the grade or grade you wish to filter to.
If your school uses only numeric grades you can use the percent score filter to narrow the results based on the percent scores earned. No matter what the criteria, this report provides a simple and straightforward process to get to the data you need once your results have been filtered.
If you'd like to work with the filtered group of students you can click on the make current student selection button to create a new student selection. Or click the add to current student selection if there's already a group you're working with and you'd like to add these new students to the list.
Exporting your report:
If you'd like to export the results click the export button.
This will generate a CSV file that includes all the report data for the filtered group of students.
No need to know field names, table names, or complicated dot tags. Getting to your data has never been easier.