

Student credit progress is one area that counselors and principals must constantly monitor. While reviewing data for individual students is fairly simple, it still involves either reviewing student records by a student’s historical grade screen, printing transcripts, or searching for and exporting the data out of the stored grades table. In any case, it often still involves manual manipulation of data just to get to the totals for students. Even then, finding out as a group which students are and are not on track can be a difficult and time-consuming process. However, with the use of our Credit Progress Report, that data is just a few clicks away.
How to run the report:
While this report will run for all students in the selected school, users can select a specific group of students with whom they want to work once the report loads. So, before navigating to the report, you can select from the start page the group of students with whom you want to work with. This can be anywhere from a single student to the entire school. Once selected, click on the RealTime Reports from the Level Data app section on the start page. Once on the dashboard, select the Credit Progress Demographics Report.
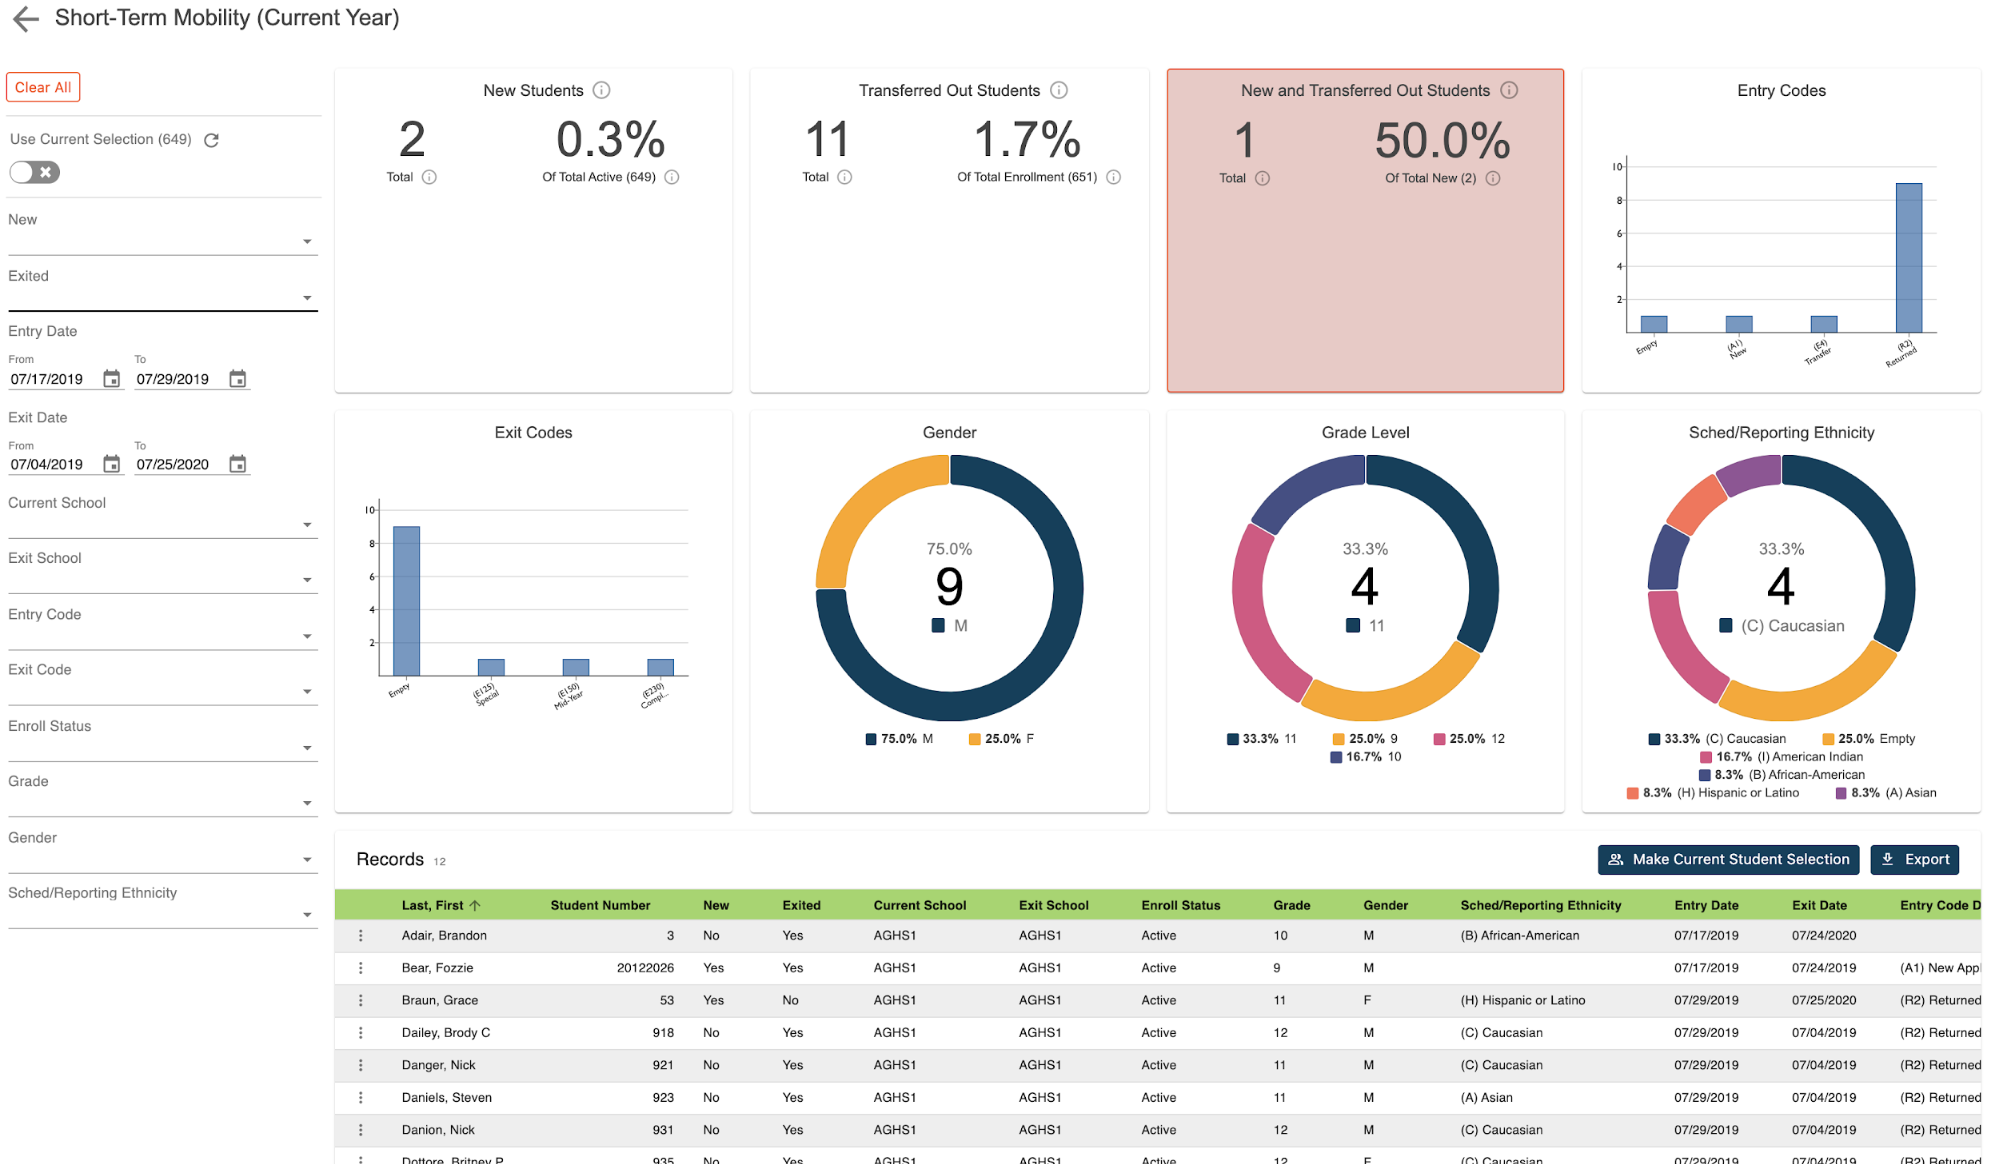
When the report loads, you'll see a graphical breakdown of earned credit by grade level, as well as by gender, grade level, and ethnicity. The graph of credit value is broken down by grade level and then by total earned credits. Each circle represents a different group of students based on the unique earned credit totals. The larger the dot, the larger the group. The smaller the dot, the smaller the group. In addition, clicking on any dot will allow the user to view the student records for that selected earning credit value.
Individual student records:
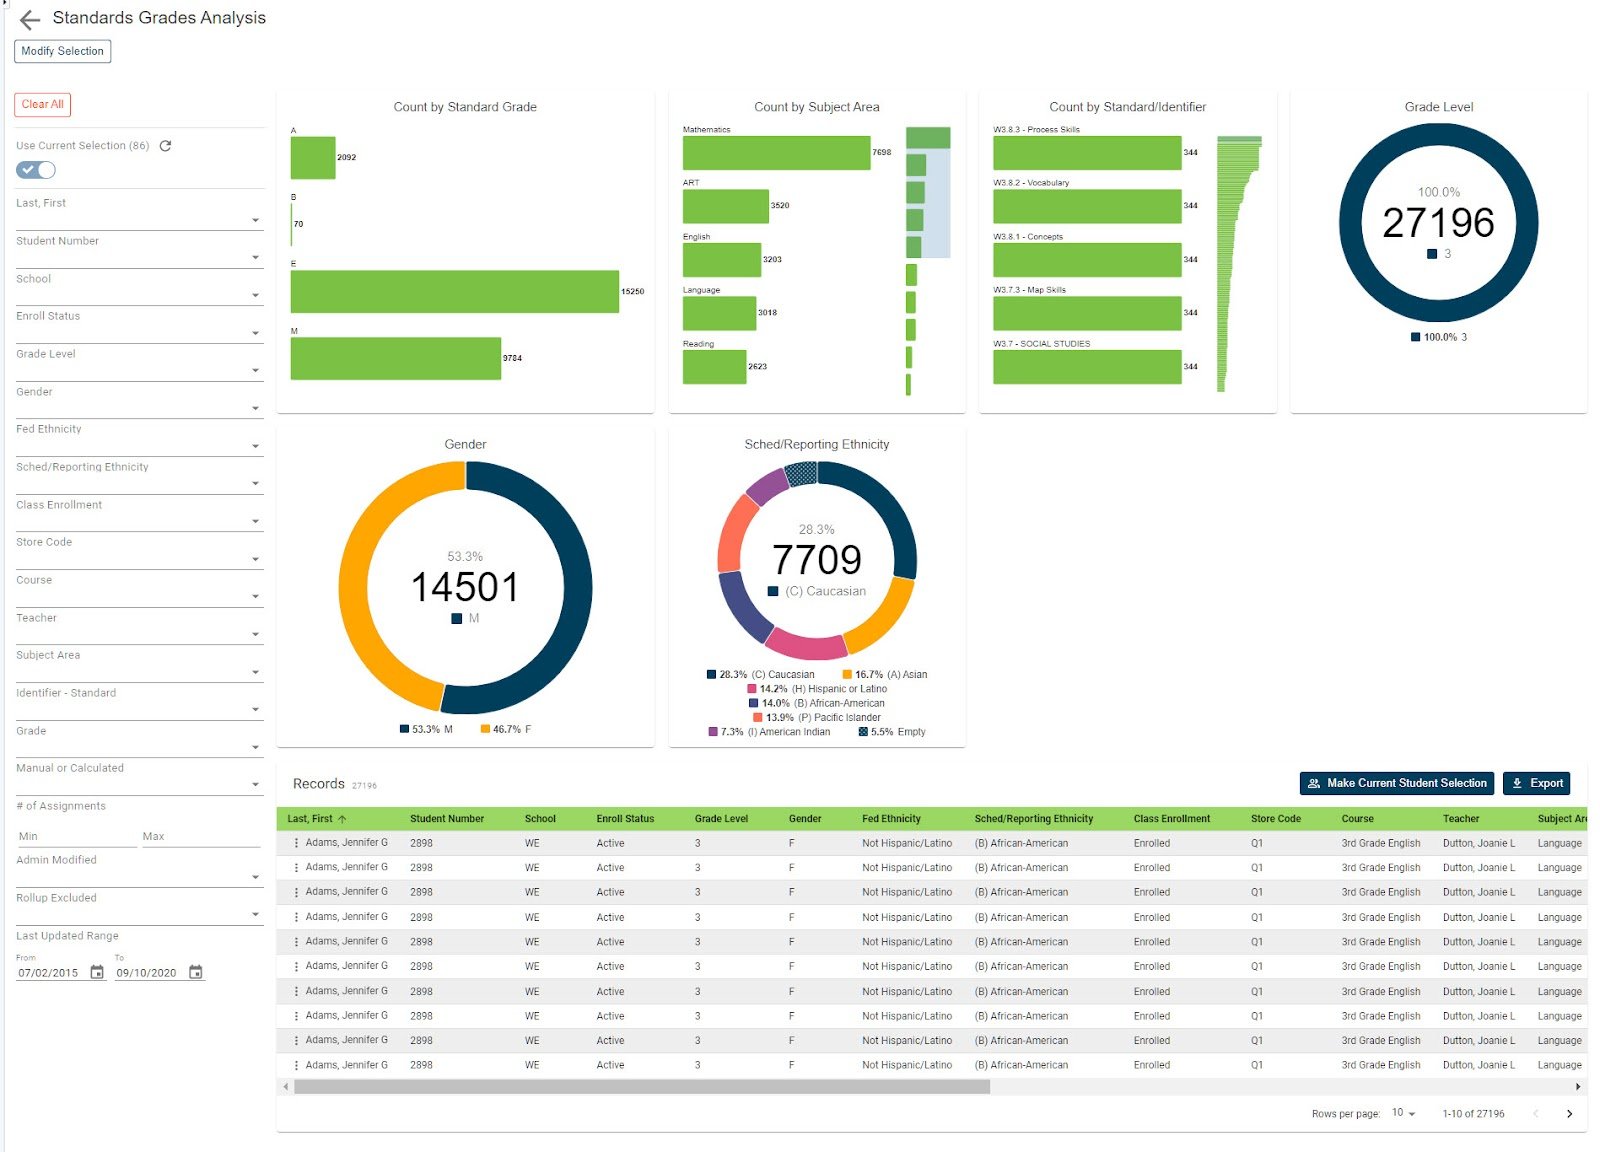
To view the individual student records, scroll down the page. In the table, you'll see a list that includes a record for each student that includes some basic demographic data, only with each student’s earned and potential credit totals. Data can be sorted by any of the column headers, which can be a particular value if sorted by the earned or potential columns. Comparing students' earned versus potential credit can shed some light on each student's performance level to date. Data from this report can be useful in identifying students that are currently not on track for success. Whether that means promotion to the next grade or even graduation, the report allows the user to simply select the grade level from the filters on the left. And then use the earned credit min/max filter to set the minimum earned credits needed to be considered on track. Any students left would then be deemed off track. Additionally, any students currently showing zero earned credits could be students that have transferred from another school. Selecting the students allows the staff members a quick way of identifying students for whom transfer records need to be entered.
By clicking the three dots to the left of the student's name, the user can then access the historical grade screen to begin the manual entry process Once all available grades have been entered, any remaining students will then be the ones staff members would need to follow up with.
Exporting your report:
Once your results have been filtered, you may want to work with the filtered group of students back on the PowerSchool side. Or even use this group as the current selection to access another report such as the Gradebook Grade Analysis. In either case, you can click the make current student selection button to create a new student selection. Or click the add to current student selection if there is already a group you are working with and you'd like to add these filtered students to that list. If you'd like to export these results, click the export button to generate a CSV file that includes all of the report data with the filtered group of students. No need to know any field names, table names, or complicated dot tags. Getting to your data has never been easier.