

Standard grading has become a popular method of tracking a student's achievement. While often used at the elementary level standards-based grading can be found at any level, configuring standards and entering scores is one part of the process, and reporting them is another. While the most common need is for individual student-based reports, schools often want to look at standards through a bigger window. However, generating this type of report is not a simple process. There aren't many built-in reports that can access the records schools need without complicated searches and exporting processes. But with the use of our Standards Grade Analysis Report, accessing standards grades has just gotten easier.
How to run the report:
Before navigating to the reports, you can select from the start page the group of students for whom you want to run the report. This can be anywhere from a single student to the entire school. Once selected, click on RealTime Reports from the Level data app section of the start page. Once on the dashboard, select Standard Grade Analysis Report, when the pre-filter appears, you'll need to select at least one reporting term for which you wish to return records.
You can also select specific subject areas if you wish to limit the results to certain subjects. If no selection is made from the subject area filter, all standard grades for the selected store code and selected students will be returned. Please note that if more than one store code and/or subject area is selected, the longer it will take to process this report.
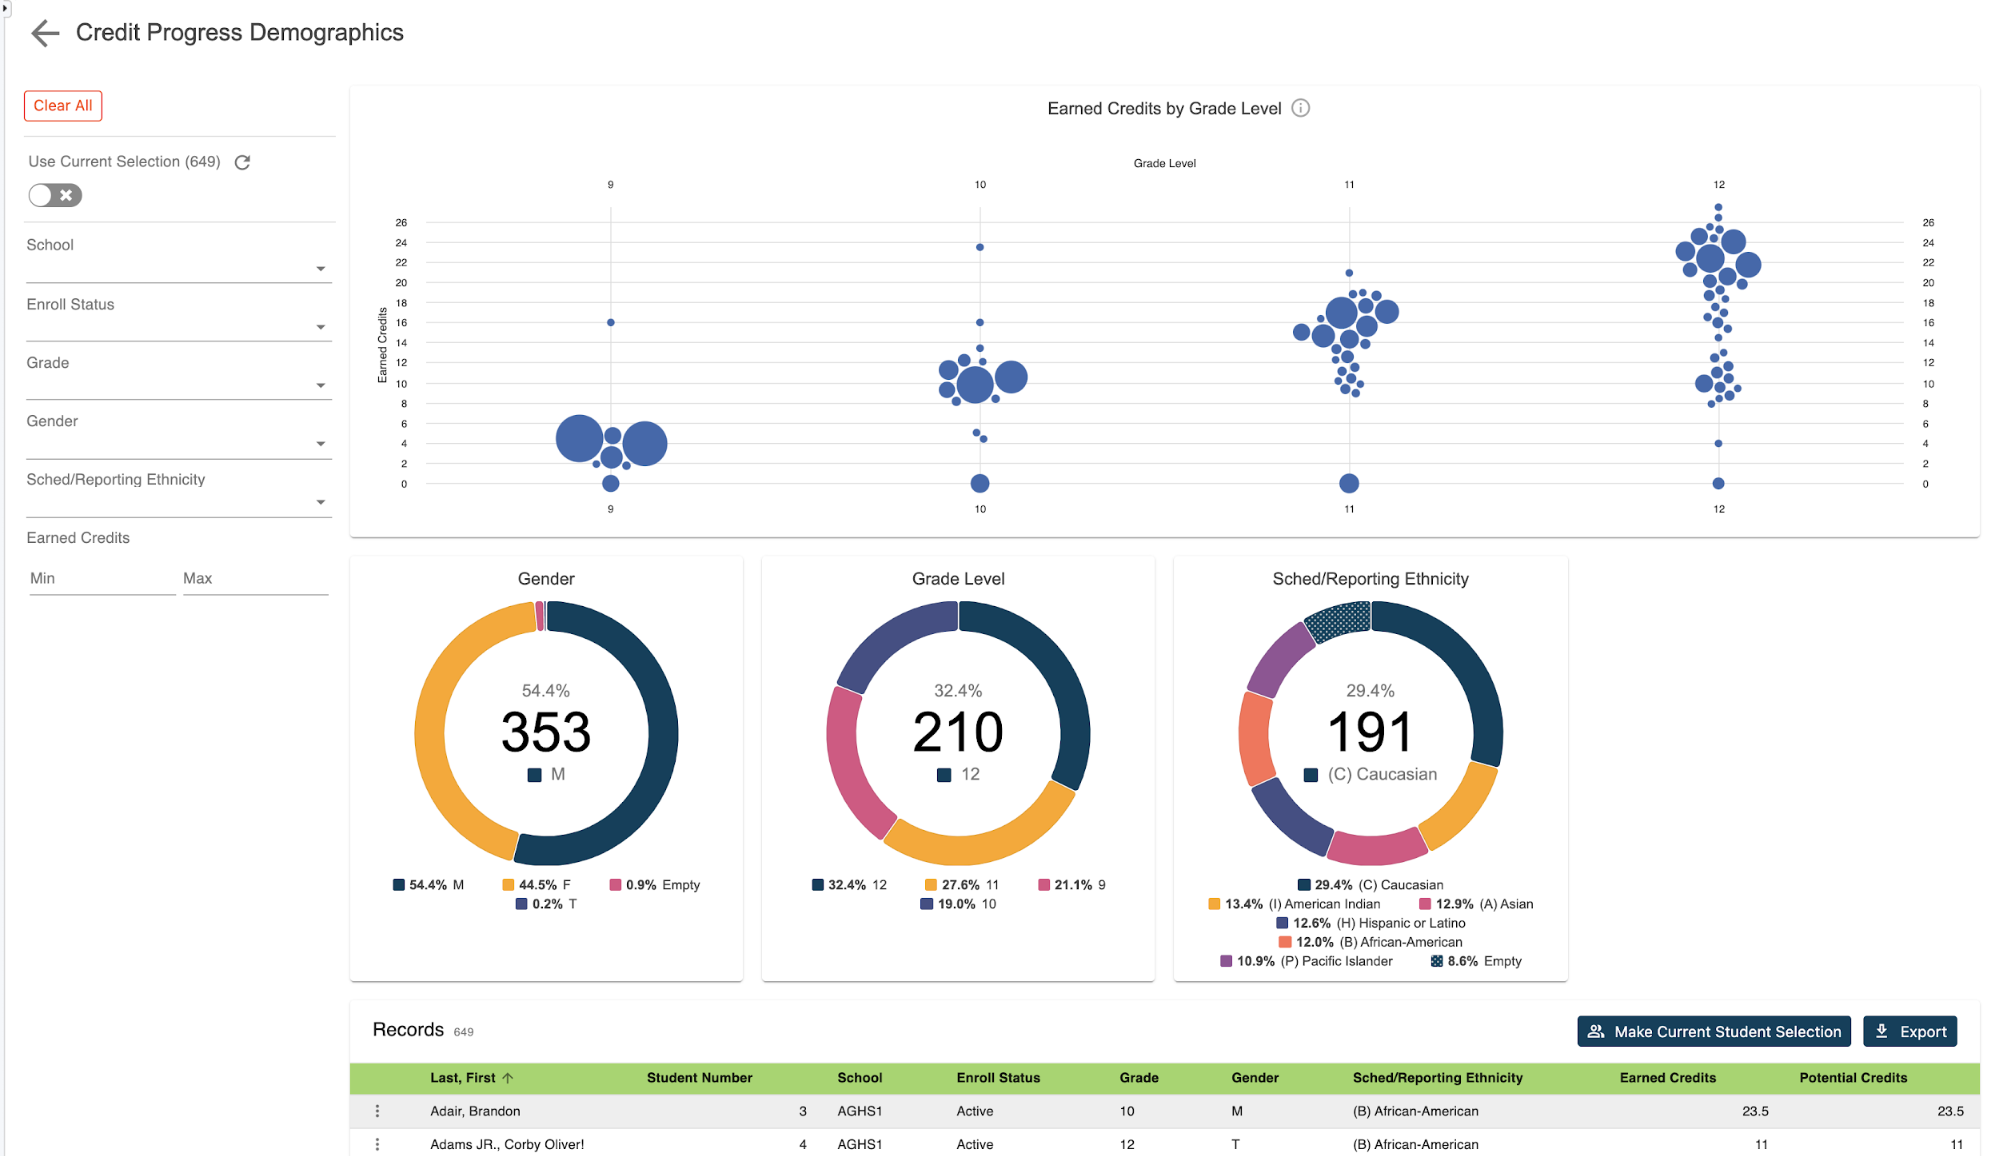
The students' selection will reflect the previously selected students. Once all selections have been made click run. When the report loads, you'll see a graphical breakdown of data by standard grade, subject area, and individual standard. In addition to a breakdown by grade level, gender, and ethnicity.
Individual student records:
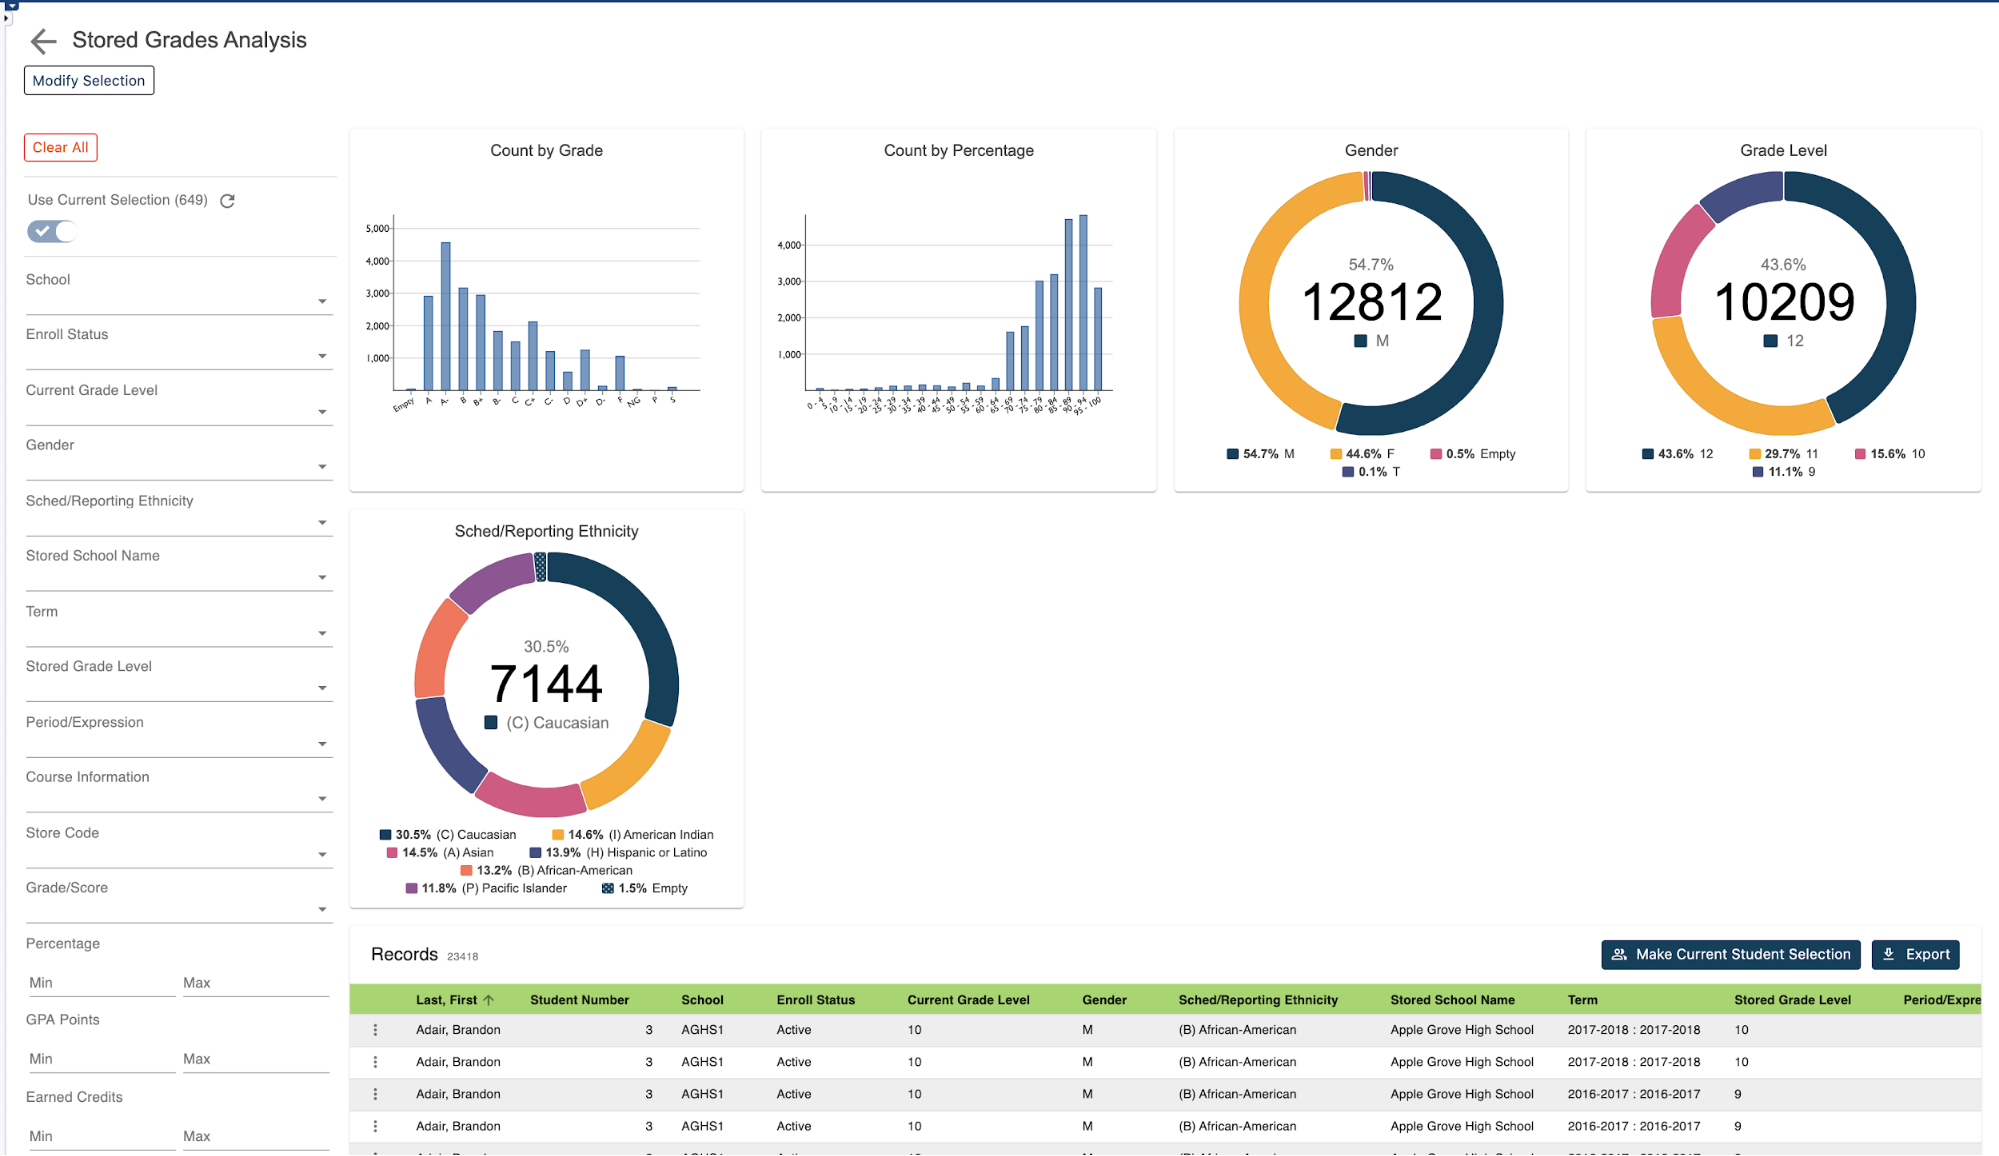
To view the individual student records, scroll down the page. In the table, you'll see a list that includes a record for each student for each course and term grade that includes some basic demographic data, along with information specific to each grade record, including the store code, enrollment status, cause, and teacher, standard name and grade and whether the grade was manually entered or was calculated from individual assignment scores. If calculated, it also shows how many assignments have been associated with that grade.
Once displayed, users can filter the date based on any of the available filters. For example, they may want to filter all records that earned a specific grade. Or they may want to review a grade distribution for a specific standard or subject area. All can be done by simply making the selections from the available filters. For example, if you'd like to see the grade distribution for a specific standard, select that standard from that graph of the filter on the left. If you would then like to filter those records to those earning a specific score, select that grade from either the graph or the filter on the left.
Exporting your report:
If you'd like to work with the filtered group of students back in PowerSchool, you can click on the make current student selection button to create a new student selection. Or you can click the add to current student selection if there's already a group you're working with and you just like to add the filtered students to that list. If you'd like to export the results, click the export button. This will generate a CSV file that includes all the report data for the filtered group of students. No need to know any field names, table names, or complicated dot tags. Getting to your data has never been easier.