

As the coronavirus pandemic swept across the nation, schools everywhere were discovering a somber truth - many people within their districts couldn’t count on a reliable internet connection. One district in rural Texas located due-South of the Greater Austin area found that 1-in-3 people, counting staff and students alike, lived in “dead zones” without internet or cell service. They were completely cut-off from the digital world at home through no fault of their own and falling behind because of it.
The digital divide isn’t limited to rural areas, though. A recent viral-Tweet from a county official in Salinas, California, showed two young girls who had resorted to using the Wi-Fi connection of a Taco Bell so they could keep up with their classwork.
When it was first launched at-scale, virtual learning seemed like a Golden Egg for schools struggling against the impact of the Coronavirus. The roll out was far from smooth and problems began compounding almost immediately, leading many to label it as a bust. Of all the problems facing virtual learning - of which there are many - the digital divide between the ‘Haves and Have-Not’s’ with regard to reliable internet access stands out in glaring detail.
Potential solutions to this problem have been hard to come-by, though a number of possibilities have been floated. Far too many districts lack an effective way to accurately measure the access to internet facing their staff and students. Some fortunate districts have been able identify their most at-risk students, but encountered further challenges posed by supply vs. demand - inventories of Wi-Fi hotspots and devices that could be rapidly distributed were quickly depleted.
The digital divide crisis goes deeper than rural vs. urban. Study after study has found that historically disadvantaged populations - Black, Latino, Native and Indigenous, and low-income families - are more severely impacted by insufficient access to technology. The Pew Research Center found that 36% of low-income students could not complete their schoolwork because of lacking internet access.
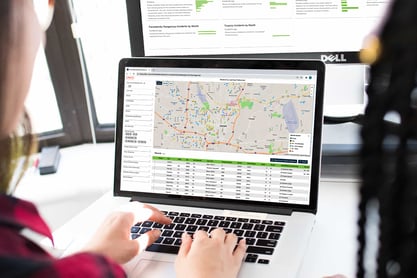
Wrestling against COVID-19 has forced schools to work creatively to craft practical solutions. Looking at school data and comparing it against external trends has become a common topic of conversation throughout the rungs of district administration at every level. Many schools have some idea about student performance, but are coming up with a partial understanding at best. Building an effective and equitable solution requires the most thorough grasp of the issues as possible. It’s not enough to only know Who, When and What. Overcoming obstacles to learning requires the ability to see Where at-risk students are within a district. 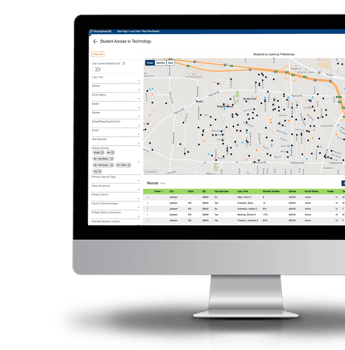 As the impact of the COVID-19 crisis on schools has continued to unfold, the need for practical ways to comprehend data has become very apparent. Because data without context is nearly impossible to fully use, a new module has been added to RealTime Reports that utilizes student geocode and location data in PowerSchool to pinpoint where students live - the Student Access to Technology report.
Raw data doesn't exist in a vacuum - there are always factors that cannot be fully tallied in any spreadsheet. These uncountables aren't just additional pieces of data - they directly influence the source of that data. Bridging the gap between schooling and external factors brings nuance to the table and makes it easier to craft equitable solutions that serve the needs of struggling students.
Outside influences - neighborhood crime rate, median household income, ambient property value, access to food/shelter/healthcare, proximity to major roadways and travel routes, etc. - have a strong bearing on academic success. Seeing where student live in relation to those factors does something that graphs, charts and spreadsheets can’t; it incorporates their humanity and their lived experiences as a key part of building bridges, overcoming obstacles, and providing the right resources to the areas they’re needed most.
Seeing the “whole person” of a school’s staff and students does more than just bridge the digital divide. It creates a the sort of complete understanding required to provide access to an equitable education, no matter the obstacles.
An equitable education that values, incorporates and respects students for who they are is a fundamental right that should be available to all. We owe it to our students to every possible resource to make that right a reality.
Click Here to Learn More about RealTime Reports and the Student Access to Technology report.