

Teachers, principals and counselors genuinely want to help students who are at-risk.
To do so, the first step is identifying those kids – and now there is an easy solution for such an enormous task – called RealTime Reports.
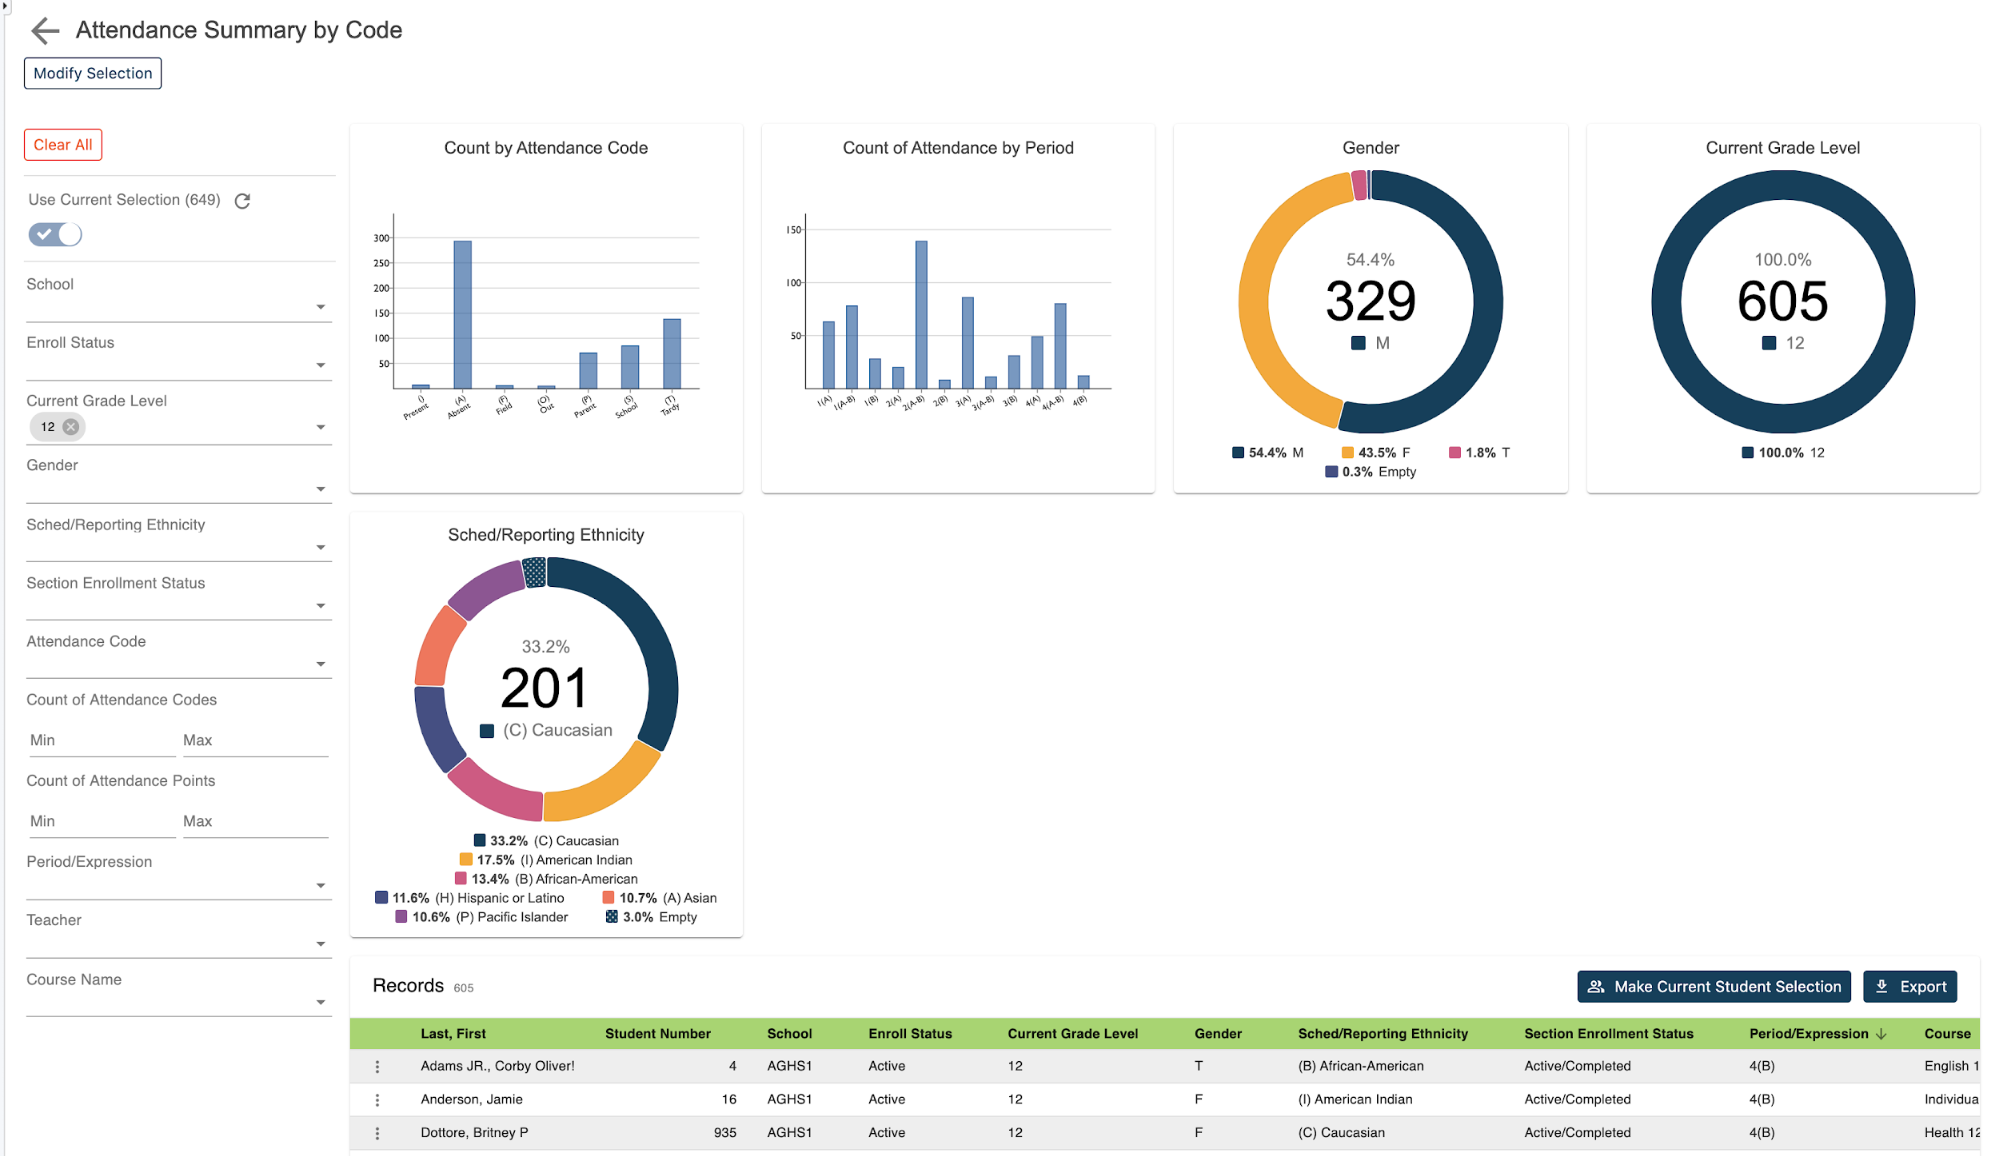
RealTime Reports seamlessly pulls a districts’ stored data to track broad trends with easy-to-review graphics and charts, yet also find students who otherwise slip through the cracks to lead school personnel to those in need with detailed lists.
RealTime Reports is the latest data extraction feature for PowerSchool developed by Level Data. It uses previously validated data to tell a story, show trends and help identify needs quickly, easily and with rigorous efficiency. This gives school districts a tool to read trends and identify areas of improvement on a broad basis as well.
Finding Kids Who Are At-Risk
One of almost 20 RealTime Reports that are available for a wide variety of applications is called Gradebook Grades Report. This featured report is even more important in a Covid-19 era where school staff and students are fragmented and not interacting in-person on a daily basis.
“Even with 1-2 days a week in the classroom and online participation it is easy to miss things, especially in this environment because there’s so much separation from the kids,” said Lisa Cahall, a former school principal who now helps school personal utilize RealTime Reports.
With Gradebook Grades Report inside of RealTime Reports, now counselors, principals and others can use various filters that are self-explanatory and easy to operate, eliminating the need to be a data savvy IT person to do the work. There are no complicated search codes or tags, nor extra database permissions. Using RealTime Reports is not any more difficult than ordering products online at Amazon and is mostly self-explanatory.
School districts may have different definitions of an at-risk student – but one of the most agreeable classifications is students who are falling too far behind in credits earned and need attention to progress to their next grade level, or graduate on time.
In Gradebook Grades Report, school staff can use a variety of filters like grades and credits earned, then whittle it down by utilizing attendance records and discipline reports in PowerSchool – and do so for an entire graduation class or school, not just one student at a time. These or other chosen filters can generate a comprehensive list in under 5 minutes of at-risk students based on any school district’s parameters or definitions.
Any user can then click on individual students and immediately have access to information like:
- Which class(es) students are failing?
- Who needs the most attention to graduate on time?
- What’s their current GPA and eligibility for sports and extra-curricular activities?
- Is it just about attendance or discipline factors – what else could be an issue?
- Is there a certain semester/quarter in high school of any given graduation class that causes more kids to stumble into the At-Risk group?...
…to name a few.
Sortable categories can also show trends in areas such as:
- School subject
- Course period
- Teachers
- Date ranges
- Enrollment status
- Ethnicity
- Earned credits…
… and more.
Such information is available inside PowerSchool, but it’s simply not easy to access – until now with RealTime Reports.
One school IT expert who went through a short training was asked if this new process would be a little bit easier than the daunting hill they would normally be climbing to gather such information. Her reply with a quip was: “That’s a lot of bit easier.”
In another case, an IT Director talked about a recent assignment from the Superintendent. The task: provide a report showing a list of at-risk students not passing their classes during the date range of Covid-19 and break it down by grade level, ethnicity, and virtual vs. in-person among a few other categories.
They were able to pull all the information out of PowerSchool, but it took 2 people 3 days to generate such a report. While they were explaining their assigned task, a Level Data demonstrator simultaneously created the same report in 5 minutes, complete with categorized lists and pie graphs.
Three days of work those 2 district staff persons can never get back – but also 3 days they won’t lose the next time.