

Schools have seen a massive change in the structure recently. No longer is in-person learning the sole standard for many districts. In addition to five-day in-person learning, schools have also adapted virtual or remote learning options, as well as hybrid models. With the change, however, comes the complexity of tracking which students are assigned to which model. Schools initially employed a variety of methods to track this information from custom fields to tracks to cohorts, the options were varied which led to each district having to develop its own methods of storing and reporting on this data.
However, to meet this need, PowerSchool created a new student screen; Digital Equity & Learning Preferences. Not only can districts use this screen to track student enrollment preferences but it also allows each district to create its own unique options, giving districts the flexibility of creating and naming their learning environments based on their own preferences. But that's not all. In addition to tracking learning preferences, schools can also use this screen to track information on digital equity. Do students have access to the internet? If so, what type, and if not, why not? Do students have access to a device? If so, what type, and is it a personal or school-provided device? And even is it a personal or shared device?
But being able to track that information is just one piece of the process. Now that it's in PowerSchool, how are schools supposed to work with it? That's where our student Access to Technology Report comes in. Not only does it provide an easy way for schools to search for and report on students' learning environments, but they can also report on students based on access to the internet or access to devices. Even more, the report has incorporated mapping to allow schools to see the actual location of students based on the filtered criteria. For example, by identifying students without internet access, districts can now identify based on density, whether a student could benefit from an individual hotspot or whether they need to come up with a more encompassing solution.
How to run the report:
To access this report from the start page, click on RealTime Reports from the Level Data app section. Once on the dashboard, select the Student Access to Technology Report. Once the report loads, a map will load showing the location of each student that has a geocode assigned to their home address. If learning preference data is assigned, the color of each student will relate to the learning preference assigned. But even if learning preference data has not been entered, you can still see the student's location plotted on the map. The key in the lower right corner, not only identifies the value associated with each color but also allows the user to filter the results by clicking on each of those values. In addition, the user can switch the categories to display students based on different options such as internet access, access type, and device access. As with most web-based maps, users can zoom in and out or even change the map type. By clicking on a single student from the map, not only filters the results in the table but also creates a pop-up screen that displays all of the students' associated data.
Individual student records:
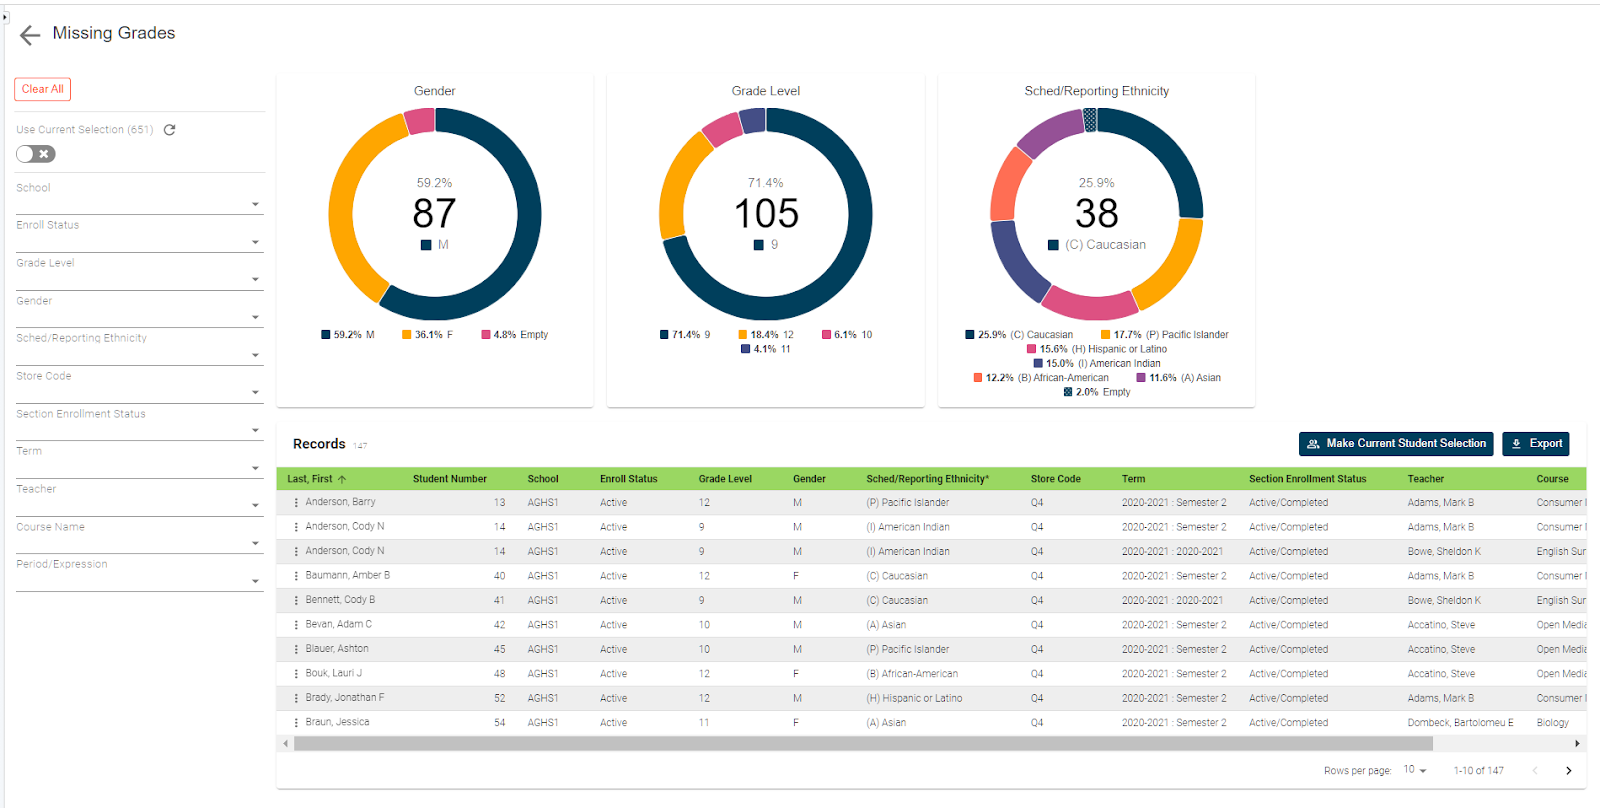
To view the individual student records, scroll down the page. In the table, you'll see a list that includes a record for every student enrolled in the school. If a student has multiple records on the Digital Equity and Learning Preference Screen, a row for each record will be included. In addition to the basic demographic data, values assigned to each of the digital equity options will also be visible. Regardless of whether any of the digital equity information is entered, a student record will still exist for each student within the current school. Data can be filtered on any of the displayed fields. For example, if you need to get a list of all students that are in person, you can filter in person from the filters on the left or make the selection directly from the map key. Do you need to find all students that have been provided a school hotspot? Well, just select those students by making the appropriate selection from the filters on the left.
Exporting your report:
Once your results have been filtered, if you'd like to work with this group of students back in PowerSchool, click on the make current student selection button to create a new student selection. Or you can click the add to current student selection if there's already a group you're working with and you'd like to add the filter students to that list. Or if you'd like to export the results, click the export button to generate a CSV file that includes all of the report data for the filtered group of students. No need to know any field names, table names, or complicated dot tags. Getting to your data has never been easier.