

Accurate attendance tracking is an important process in any school. While entering the data is pretty straightforward, being able to retrieve that data in a quick and straightforward manner is another story, especially when trying to access data for multiple students, sections, periods, or days. But now with the use of our Meeting Attendance Details Report, schools can now retrieve meeting attendance records for any selected group of students for any date range and then narrow the results by student, attendance date, course, teacher, period, or code.
How to run the report:
Before navigating to the report, you can select from the start page the group of students for whom you want to run the report. This can be anywhere from a single student to the entire school. Once selected click on RealTime Reports from the Level Data app selection of the start page. Once in the dashboard, select the meeting attendance details report. Once the pre filter appears you'll enter the date range for which you wish to run the report. Next, select specific attendance codes and/or specific attendance periods. IF no selections are made for either attendance or period, the report will return records for all students, codes, and periods for the selected date range. The student selection will indicate the groups of students you've previously selected. Once all options have been made, click run.
Once the report runs:
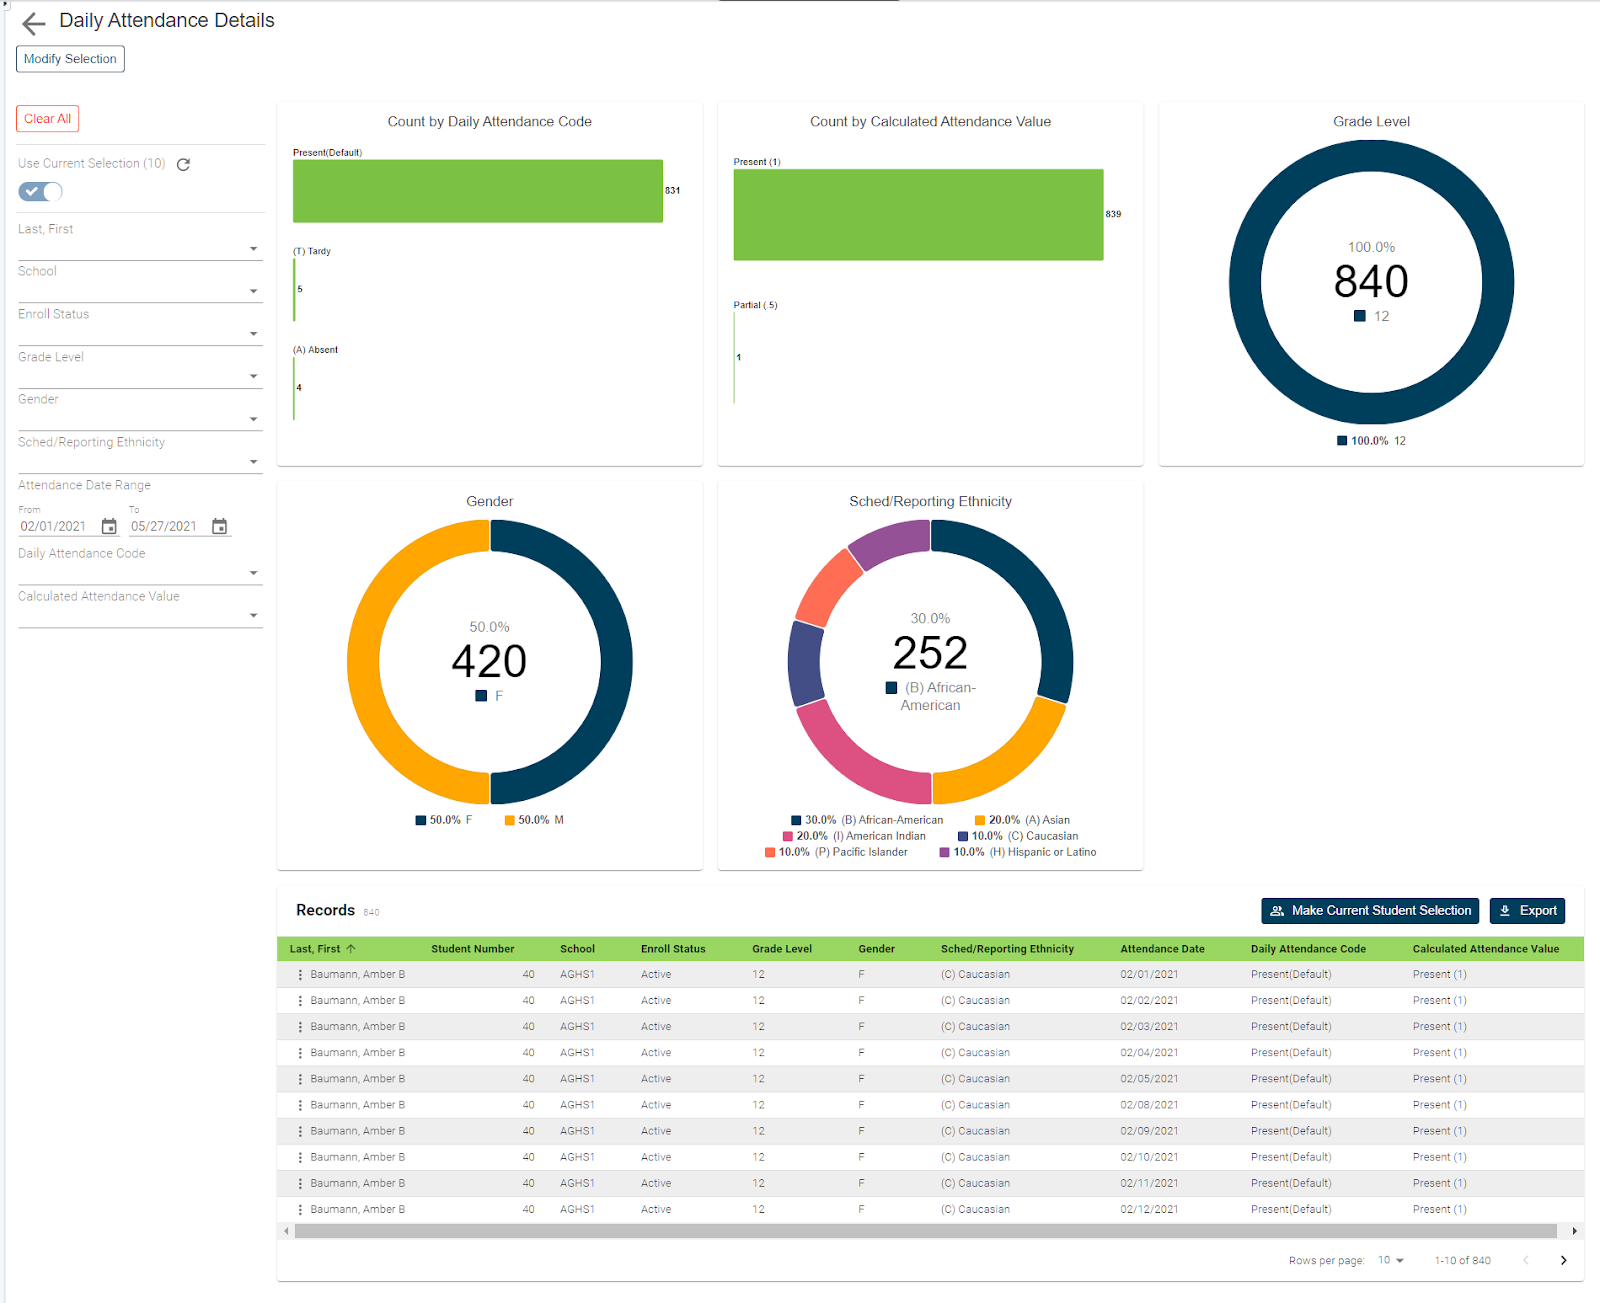
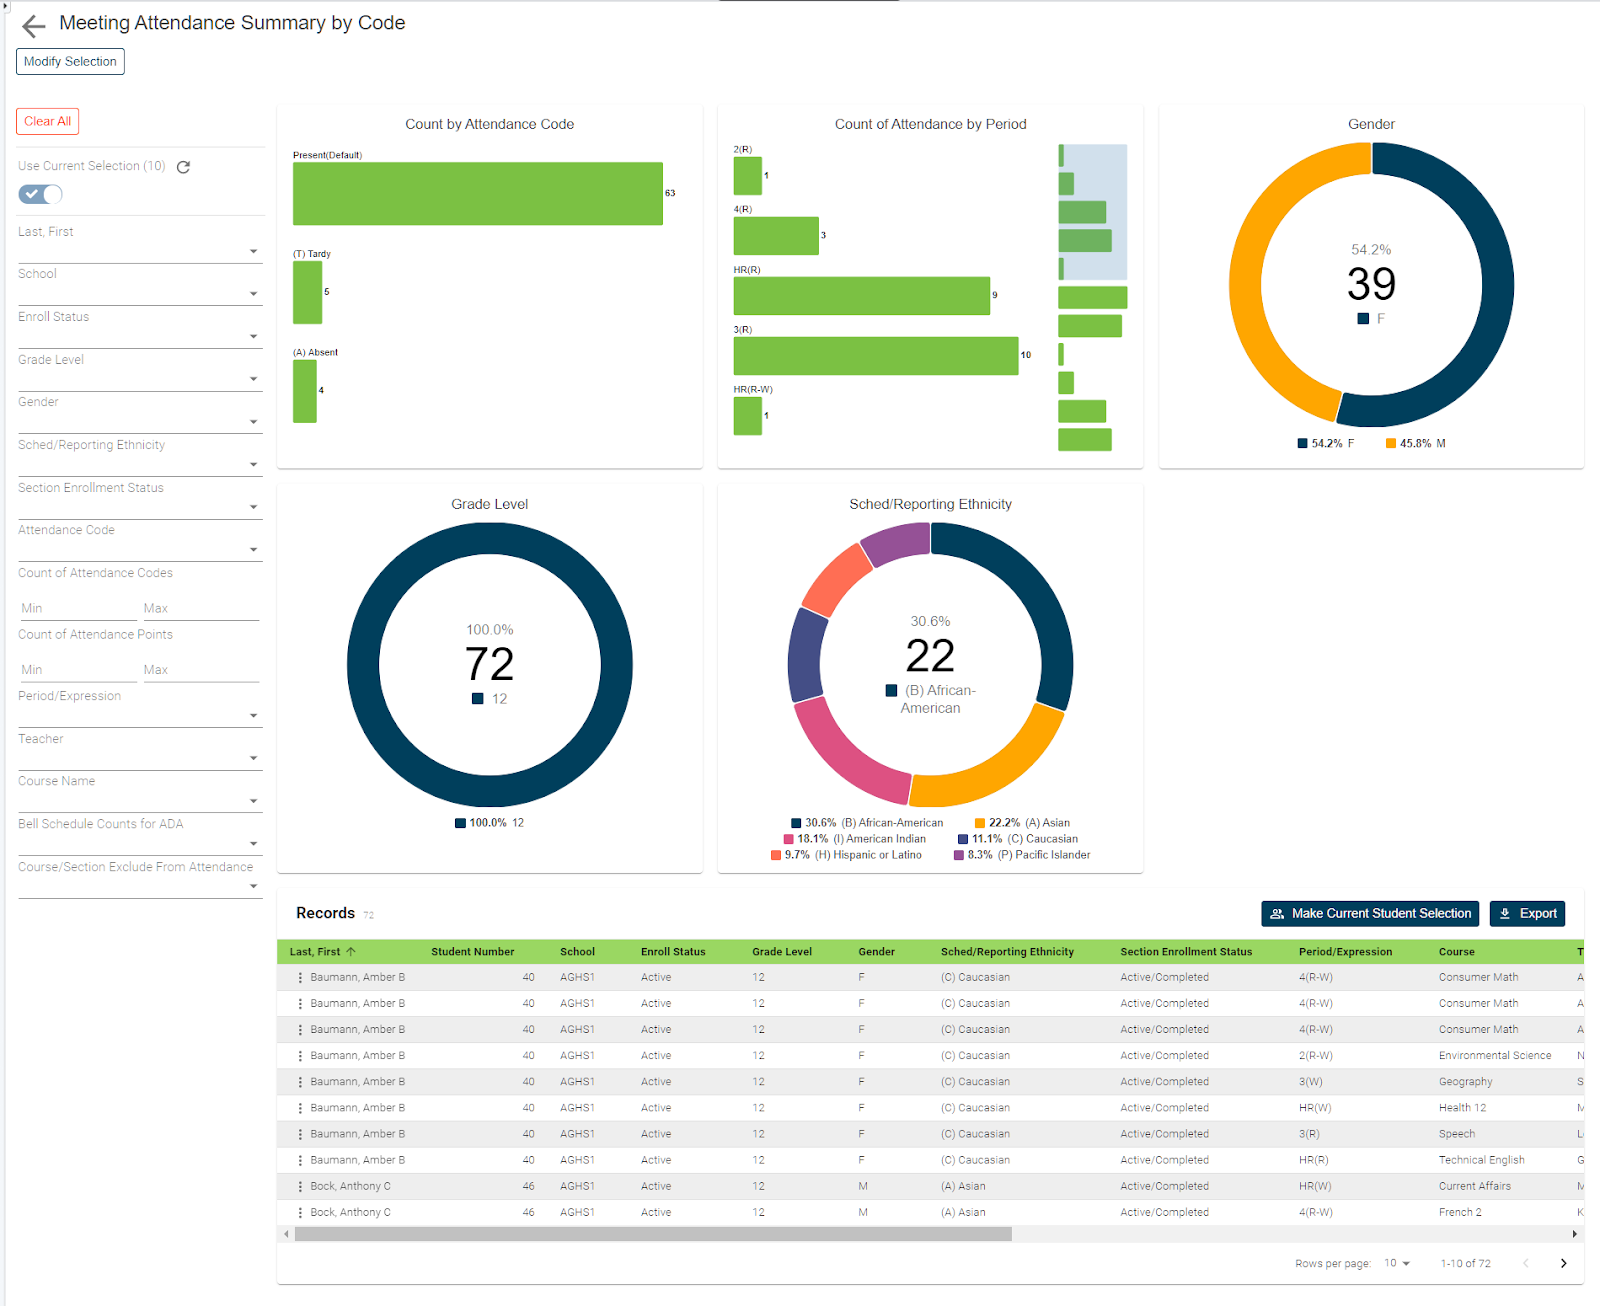
Once the report loads you'll see a graphical breakdown of those students based on the associated attendance codes and periods. The count of attendance code column will show a tally of all attendance codes assigned during the selected date range. The count by period graph will show the account of attendance codes, associated to each period or expression. Filtering to a specific attendance code would then allow the user to see a breakdown of how often a specific code is assigned to each unique period throughout the requested time frame. In addition to the attendance graph, you'll also see breakdowns of student data by grade level, gender, and scheduling ethnicity.
Individual student records:
To view the individual student records, scroll down the page. In the table you'll see a list that includes a record for every student from the original selection for each class, and for each day within the specified date range. In addition, you’ll see the associated course and teacher name, along with the period the class meets. Student data can be filerterd or sorted based on any of the displayed fields. For example, sorting the report by course or teacher allows the user to look at attendance from a slightly different perspective. Rather than focusing on attendance at just the student level, users can also now identify attendance errors by period the class meets, course, or teacher. In addition, when the reports run for an extended date range, you can use the attendance date filter to narrow the results for any single date or date range within that originally specified time frame.
Exporting your report:
Once your results have been filtered, if you'd like to work with the selected group of students back in PowerSchool, you can click on the make current student selection button to create a new student selection. Or you can click the add to current student selection if there's already a group you're working with and you'd like to add these selected students to that list. Or if you just need to export the results, click on the export button to generate a CSV file that includes all the data for the filtered group of students. No need to know any field names, table names, or complicated dot tags. Getting to your data has never been easier.