

Attendance can be a complicated process.
Does your school use meeting attendance, daily attendance, a combination of both?
Depending on how your school enters attendance plays a huge part in what you can actually retrieve. Typically for schools to track meeting attendance, the only way to retrieve data is on a course-by-course basis.
However, what if you need to know for a student what codes were entered on a given day or how many times a specific code was entered. Maybe you need to know how many students had more than one, two, or three different codes assigned throughout the day. Getting to that data can be a rather cumbersome process. That is until now.
With the use of our Meeting Attendance Summary by Date Report, schools can now retrieve aggregated meeting attendance values for each student and easily filter the data by date range, attendance, number of occurrences, and even the number of unique codes assigned each day
How to run the report:
Before navigating to the reports, you can select from the start page the group of students for whom you want to run the report. This can be anywhere from a single student to the entire school.
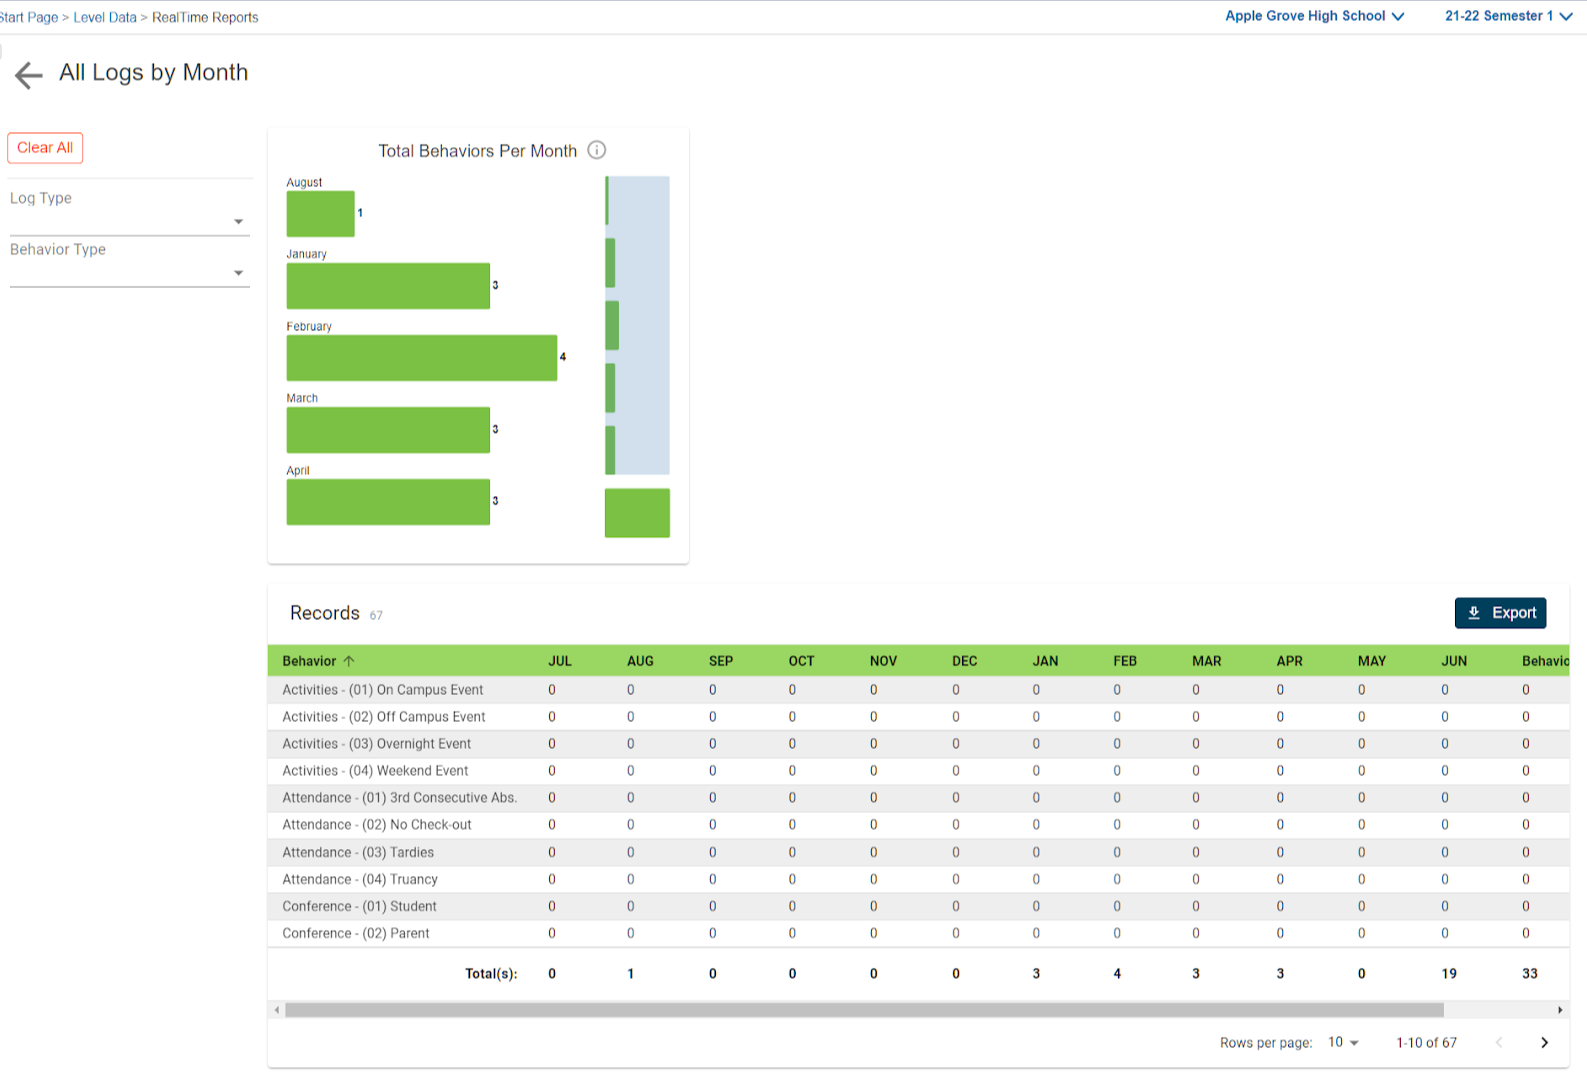
Once selected, click on the RealTime Report link from the Level Data app section of the start page. Once on the dashboard, select the meeting attendance summary by date report. Once the pre filter appears, you'll enter the date range for which you wish to report. Next, you can select a specific attendance code or codes. If no selection is made, the report will return a record for all students and codes for the selected date range. The student selection will indicate the group of students you’ve previously selected. Once all selections have been made, click run.
Once the report loads:
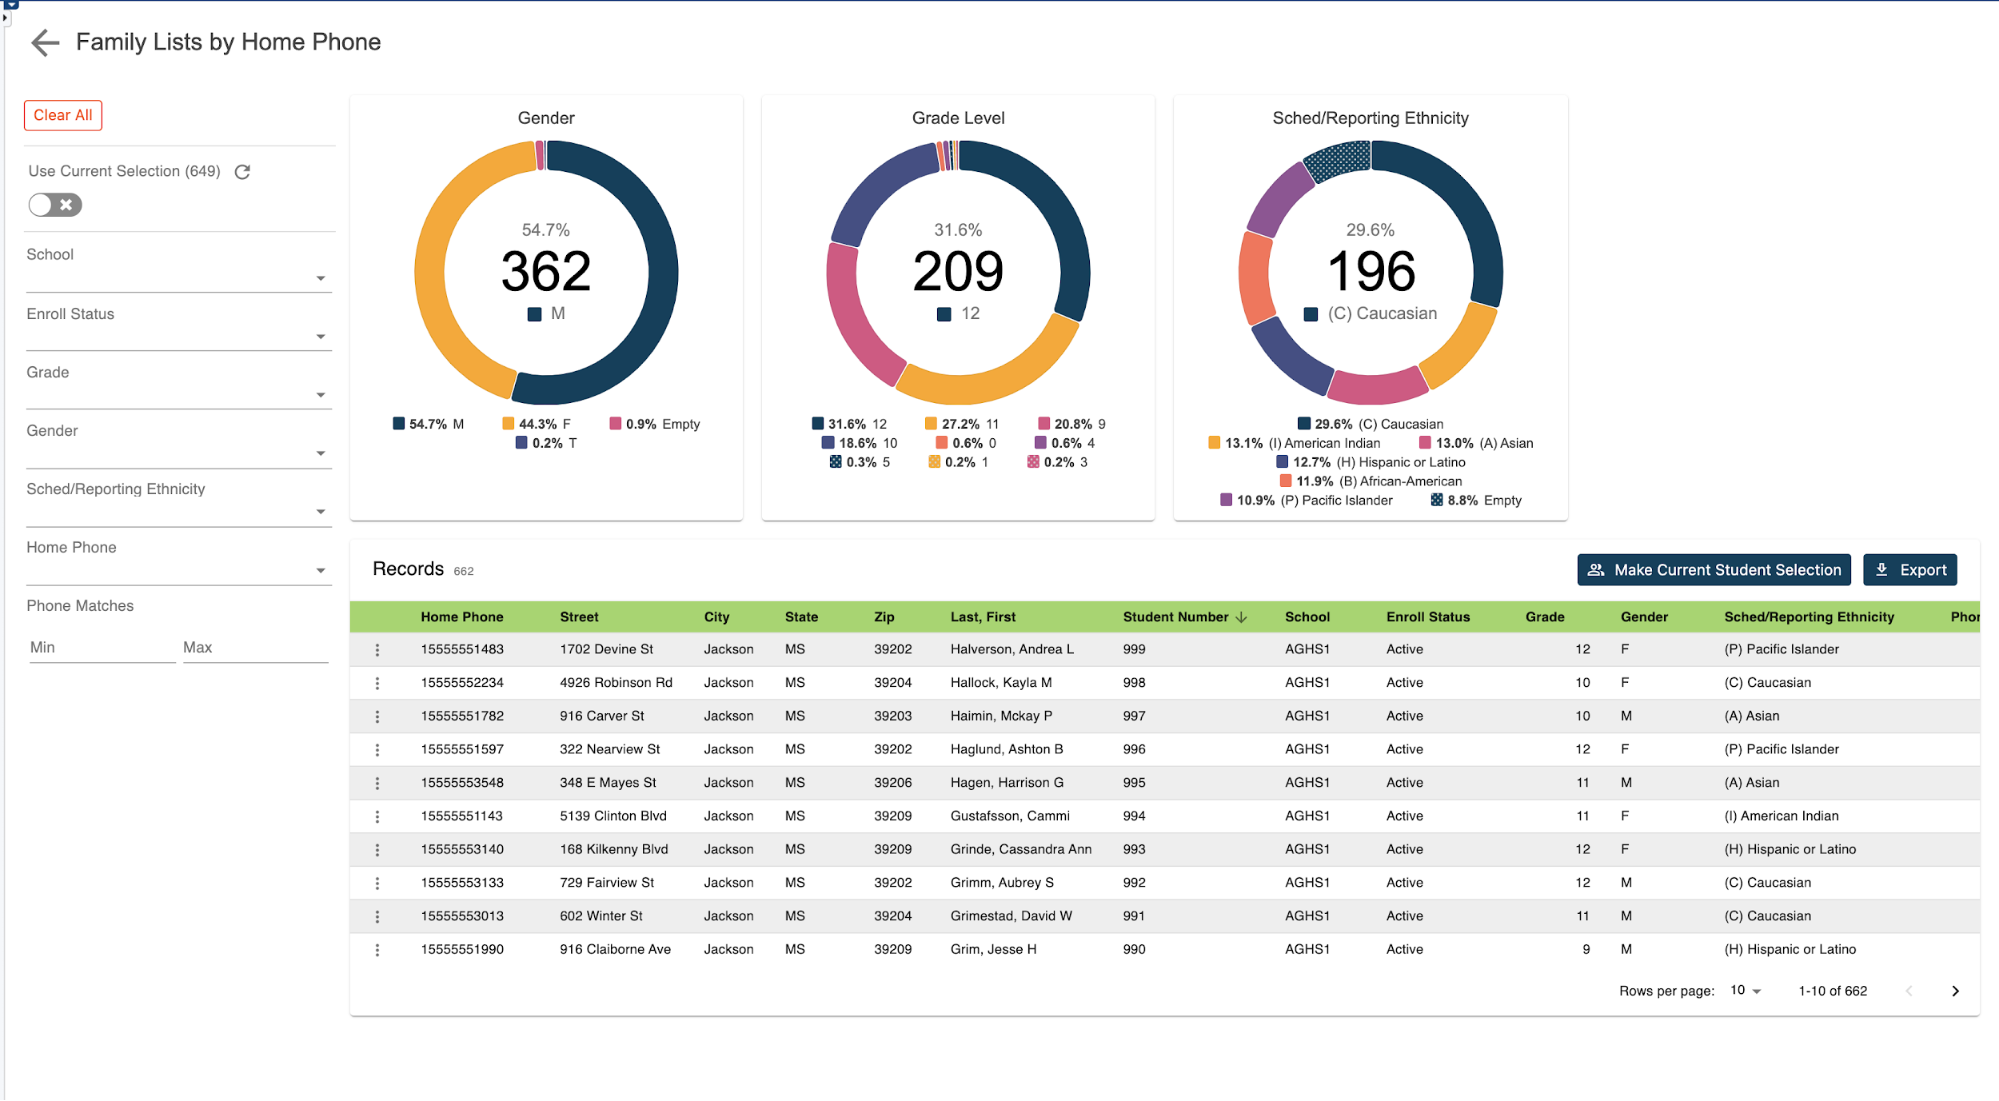
Once the report loads, you'll see a graphical breakdown of those students based on associated attendance codes. The count of attendance code graph will show a tally of all attendance codes assigned during the selected date range. Filtering to a specific attendance code would then allow the user to see a breakdown of how often a specific code is assigned for each student, for each day within the requested time frame. In addition to the attendance graphs, you'll also see a breakdown of students by grade level, gender, and scheduling ethnicity.
Individual log records:
To view the individual student records, scroll down the page. In the table you'll see a list that includes a record for every student from the original selection for each day within the selected time frame, along with the associated attendance codes and how many times each code was assigned.
Student data can be filtered based on any of the displayed fields. For example, you can select an attendance code or codes from the attendance code filter and then use the count of attendance codes to limit to those students that have reached a specific threshold. Or you can search for a student based on a number of unique codes assigned on a given date.
For example, if you'd like to find students that have at least two unique attendance codes assigned, set the unique attendance code count to a minimum of two. This will filter to only those students that have at least two unique attendance codes assigned for any date within the given date range.
Exporting your results:
Once your results have been filtered, if you'd like to work with the selected group of students back in PowerSchool, you can click on the make current student selection button to create this as a new student selection. Or you can click the add to current student selection if there's already a group of students you're working with and you'd like to add the new students to that group. If you'd like to export the results, just click the export button to generate a CSV file that includes all of the report data for the filtered group of students.
No need to know any field names, table names, or complicated dot tags.
Getting to your data has never been easier.