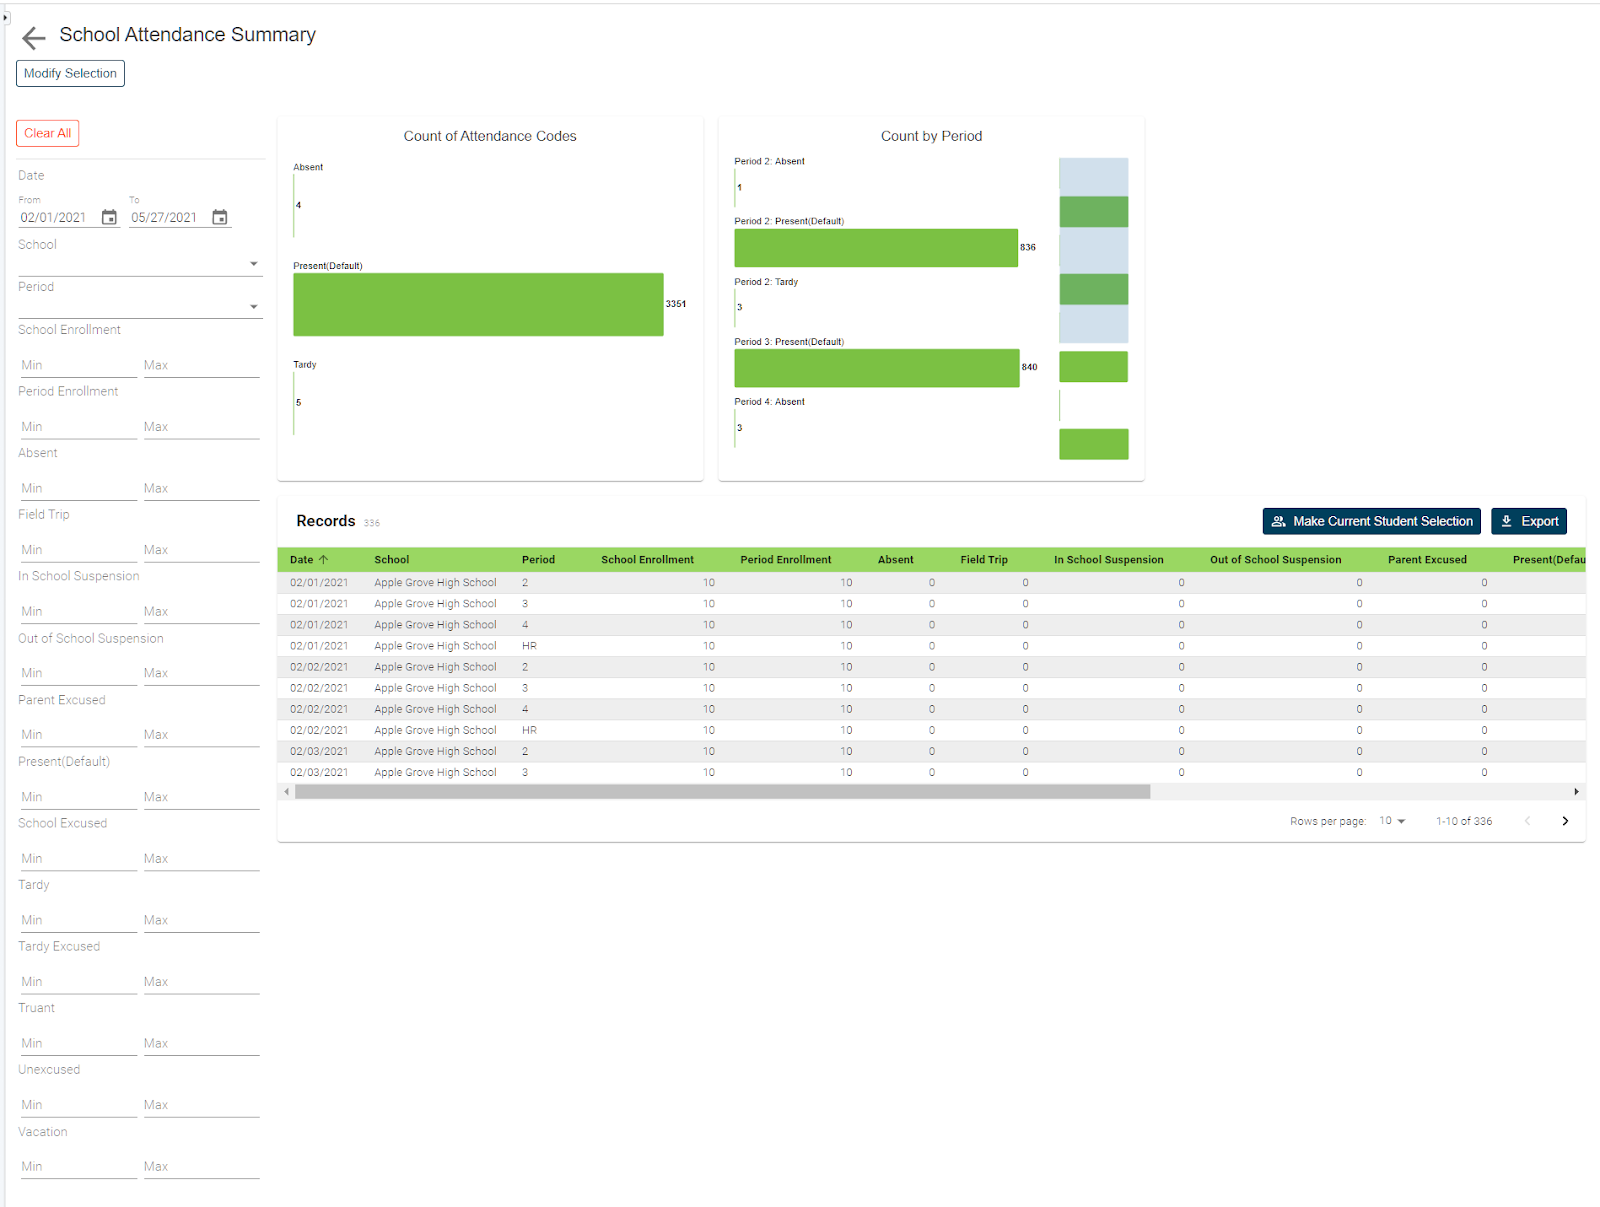


For schools that track meeting attendance, retrieving detailed attendance records is only one piece of the puzzle. In many cases, schools have standard policies regarding the accumulation of certain attendance codes per class meeting.
As a result, identifying students that have accumulated a specific number of absences, tardies, or a combination of those is even more important.
While getting to the day-to-day records for individual students is pretty straightforward, getting to that data for larger groups and then being able to filter based on codes or numbers of occurrences just complicates the whole process.
With the use of our meeting attendance summary by code report, schools can now retrieve aggregated meeting attendance data and easily filter the data by date range, period, course, attendance code, and most importantly, number of occurrences.
How to run the report:
Before navigating to the report, you can select from the start page the group of students for whom you want to run the report. This can be anywhere from a single student to the entire school.
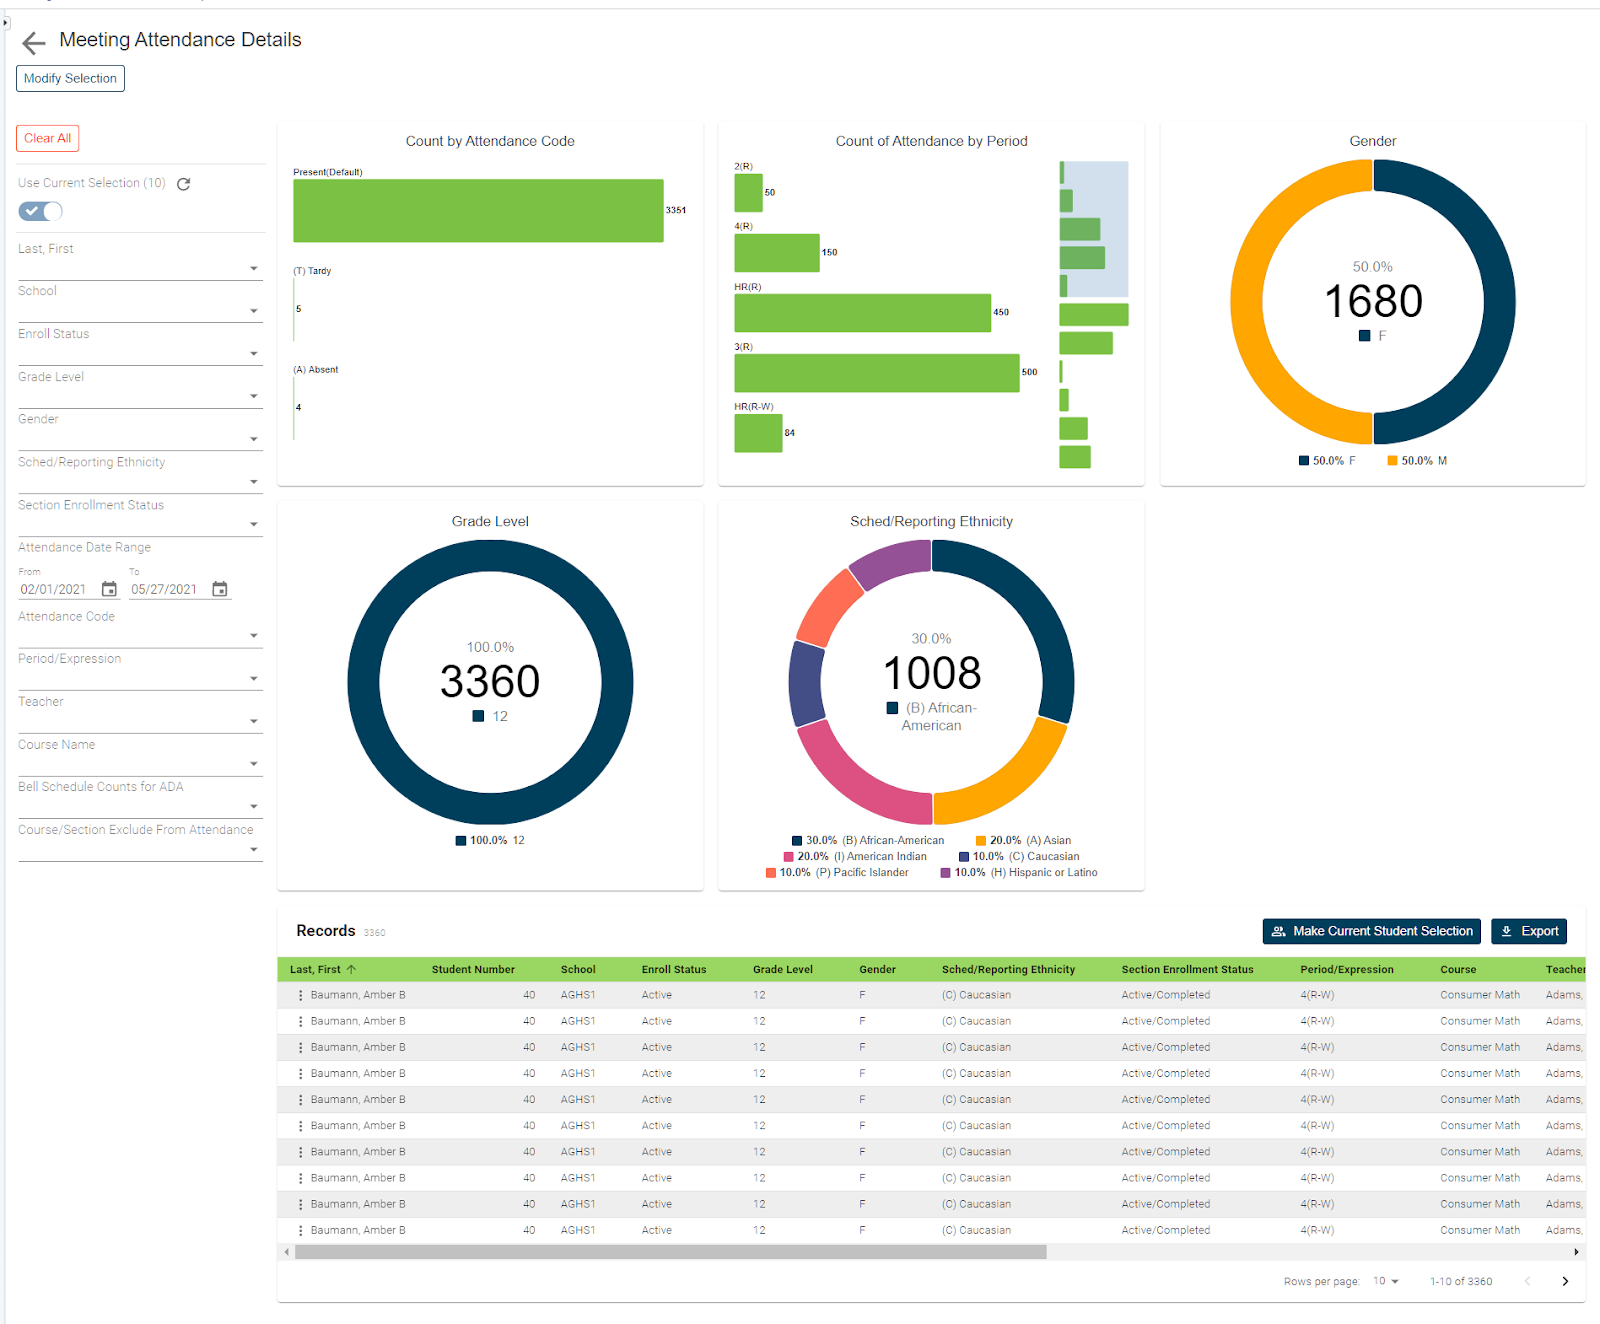
Once selected, click on RealTime Reports from the Level Data apps selection of the start page. Once on the dashboard, select the meeting attendance summary by code report. Once the prefilter appears, you'll enter the date range for which you wish to report.
Next you'll select the specific attendance codes and/or specific attendance periods. If no selection is made for either attendance code or periods, the report will return records for all students, all codes, and all periods for the selected date range.
The students selection will indicate the group of students you previously selected. Once all selections have been made, click run.
Once the report loads:
Once the report loads, you'll see a graphical breakdown of those students based on associated attendance codes and periods.
The count of attendance code graph will show a tally of all attendance codes assigned during the selected date range. The count by period graph will show an account of attendance codes associated to each period or expression.
Filtering to a specific attendance code, would then allow the user to see a breakdown of how often a specific code is assigned for each unique period throughout the requested time frame.
In addition to the attendance graphs, you'll also see a breakdown of student data by grade level, gender, and scheduling ethnicity.
Individual student records:
To view the individual student records, scroll down the page. In the table you'll see a list that includes a record for every student from the original selection for each course and unique attendance code assigned, including students marked present by default within the selected date range, along with the count of how many times each code has been applied.
Student data can be filtered based on any of the displayed fields. For example, you can select an attendance code or codes from the attendance code filter and use the count of codes filter to limit to those students that have reached a specific threshold.
Exporting your report:
Once your results have been filtered, if you'd like to work with the selected group of students back in PowerSchool, you can click on the make current student selection button to create a new student selection.
Or you can click the add to current student selection if there's already a group you're working with and you'd like to add these selected students to that list.
Or if you just need to export the results, click on the export button to generate a CSV file that includes all the data for the filtered group of students. No need to know any field names, table names, or complicated dot tags. Getting to your data has never been easier.